
Bitcoin and Stocks: Does Correlation Kill Diversification?
Bitcoin has long been marketed as an asset uncorrelated with equity markets. Data since 2020 tells a more nuanced story, particularly during periods of stress. Here's what that concretely means for portfolio allocation.

Sector ETF vs Index ETF: Which Should You Choose?
A sector ETF promises higher upside, but at what risk cost? A comparison with the classic broad index ETF.

AI Algorithmic Trading: Real Uses vs. Marketing Hype
Between marketing promises and real-world use, where does AI in algorithmic trading actually stand today? A hype-free assessment of concrete contributions and structural limits.

Sortino Ratio vs Sharpe Ratio: Which One Should You Use?
The Sortino ratio fixes a major flaw in the Sharpe ratio by penalizing only downside volatility. Comparison, calculation, and a worked example.

Value at Risk (VaR) Explained: Measuring a Portfolio's Loss Risk
Value at Risk is one of the most widely used risk metrics in finance. How to calculate it, what it actually tells you, and why it doesn't tell you everything.

Portfolio correlation: why your diversification may be illusory
Holding twenty positions isn't enough to diversify a portfolio if they all move together. Here's how to measure real correlation between your assets, and why it spikes exactly when you need diversification most.
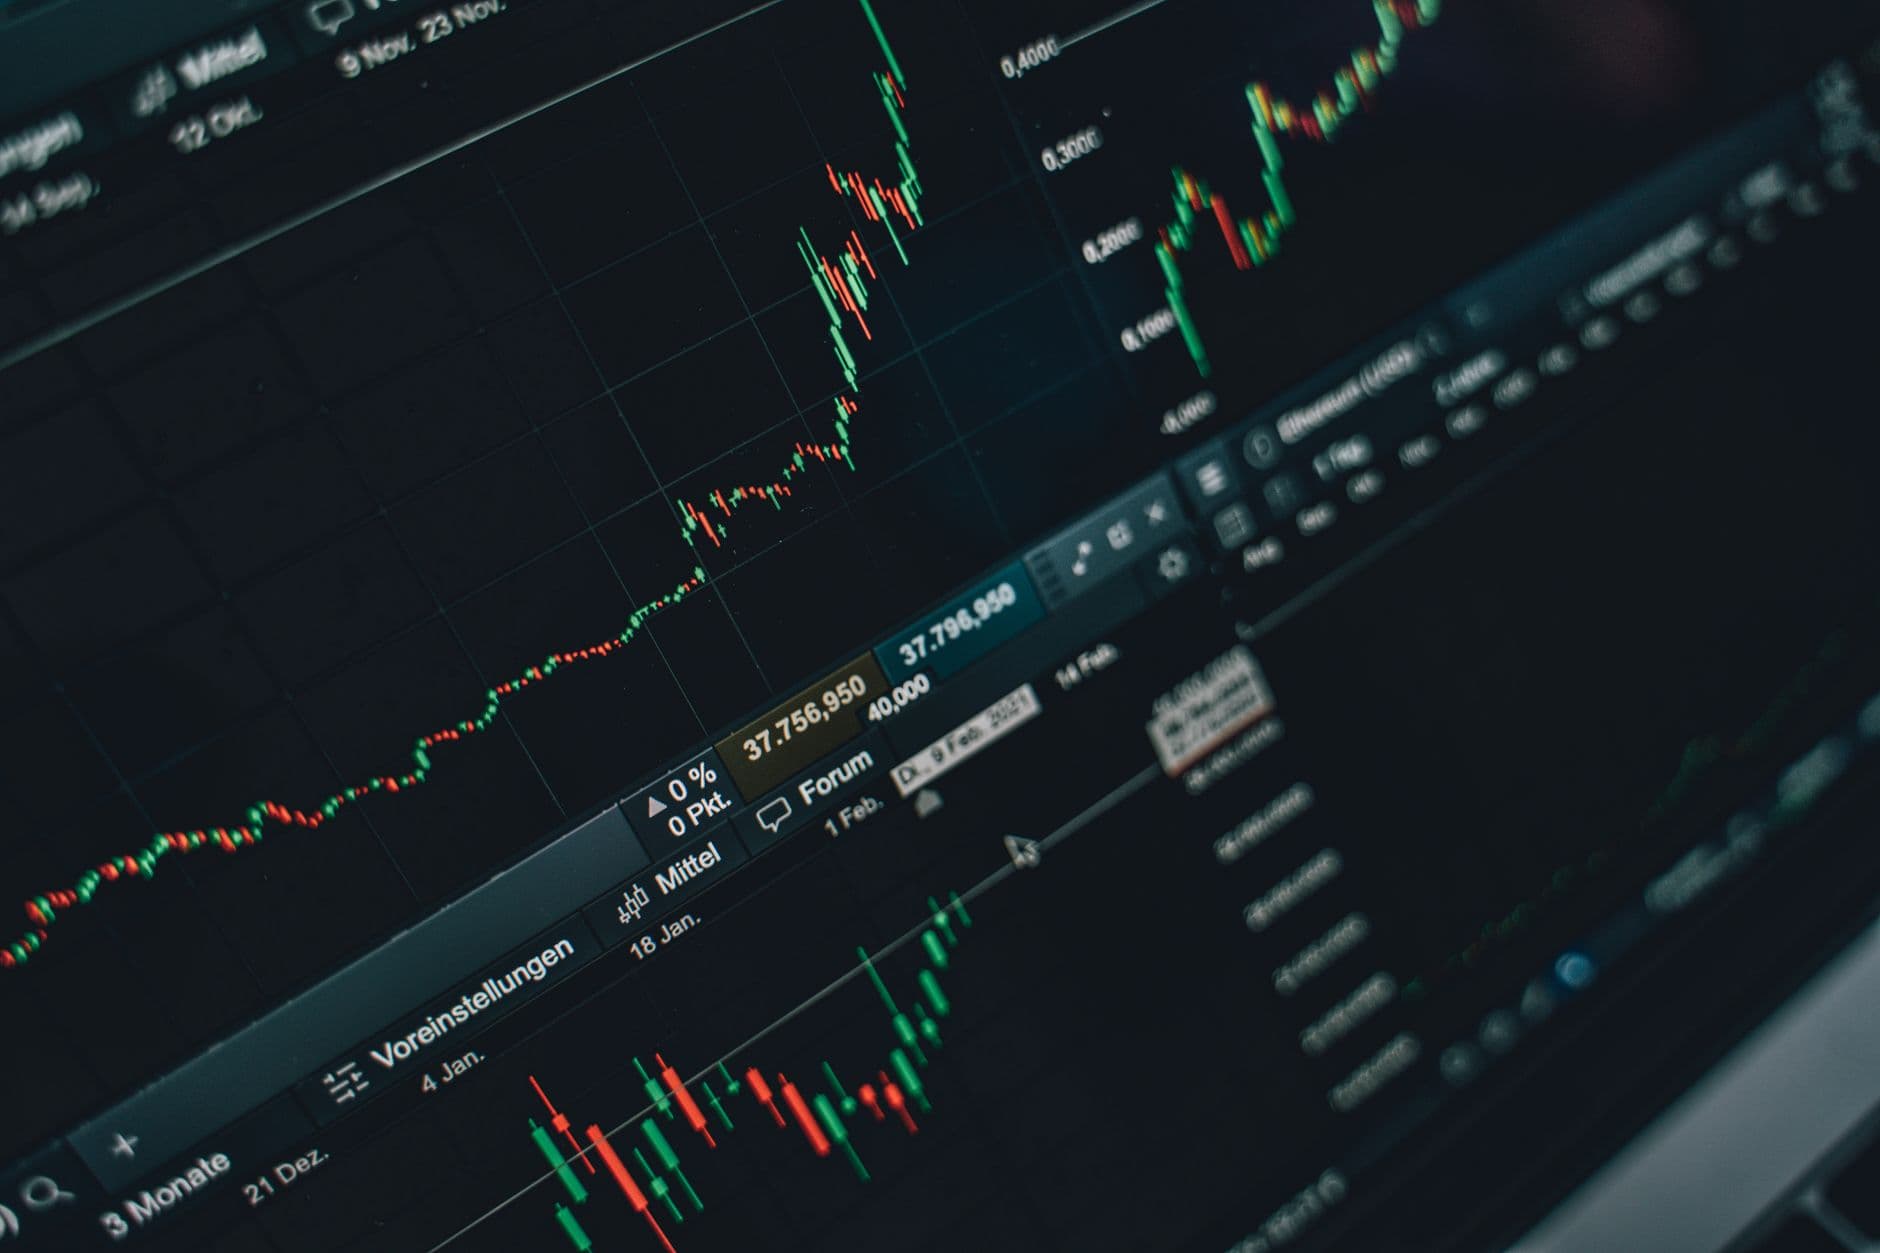
Why the Sharpe ratio isn't enough to judge a strategy
A high Sharpe can hide a catastrophic drawdown or pure luck from multiple trials. Here are the blind spots of the most-used ratio in quant finance, and how to fill them.
New free ebook: Systematic Portfolio Optimization
A free reference guide on the complete institutional quant pipeline: RMT spectral filtering, shrinkage, risk parity, regime detection and Half-Kelly sizing.

Data-snooping in trading: the beginner quant's #1 trap
Testing 1000 variants then keeping the best guarantees a nice backtest… and a live letdown. Here's how to spot data-snooping and protect yourself with the Deflated Sharpe Ratio.

Fractional Kelly in practice: taming the optimal formula
The Kelly criterion is optimal in theory and ruinous in practice. Here's why, and how to fraction it to build position sizing that survives real-world uncertainty.
This week in markets (Aug 3–9, 2026): quant dispersion, a cautious ECB
Magnificent Seven earnings, a striking performance gap between quant funds, and the ECB holding steady: this week's signal, without the noise.
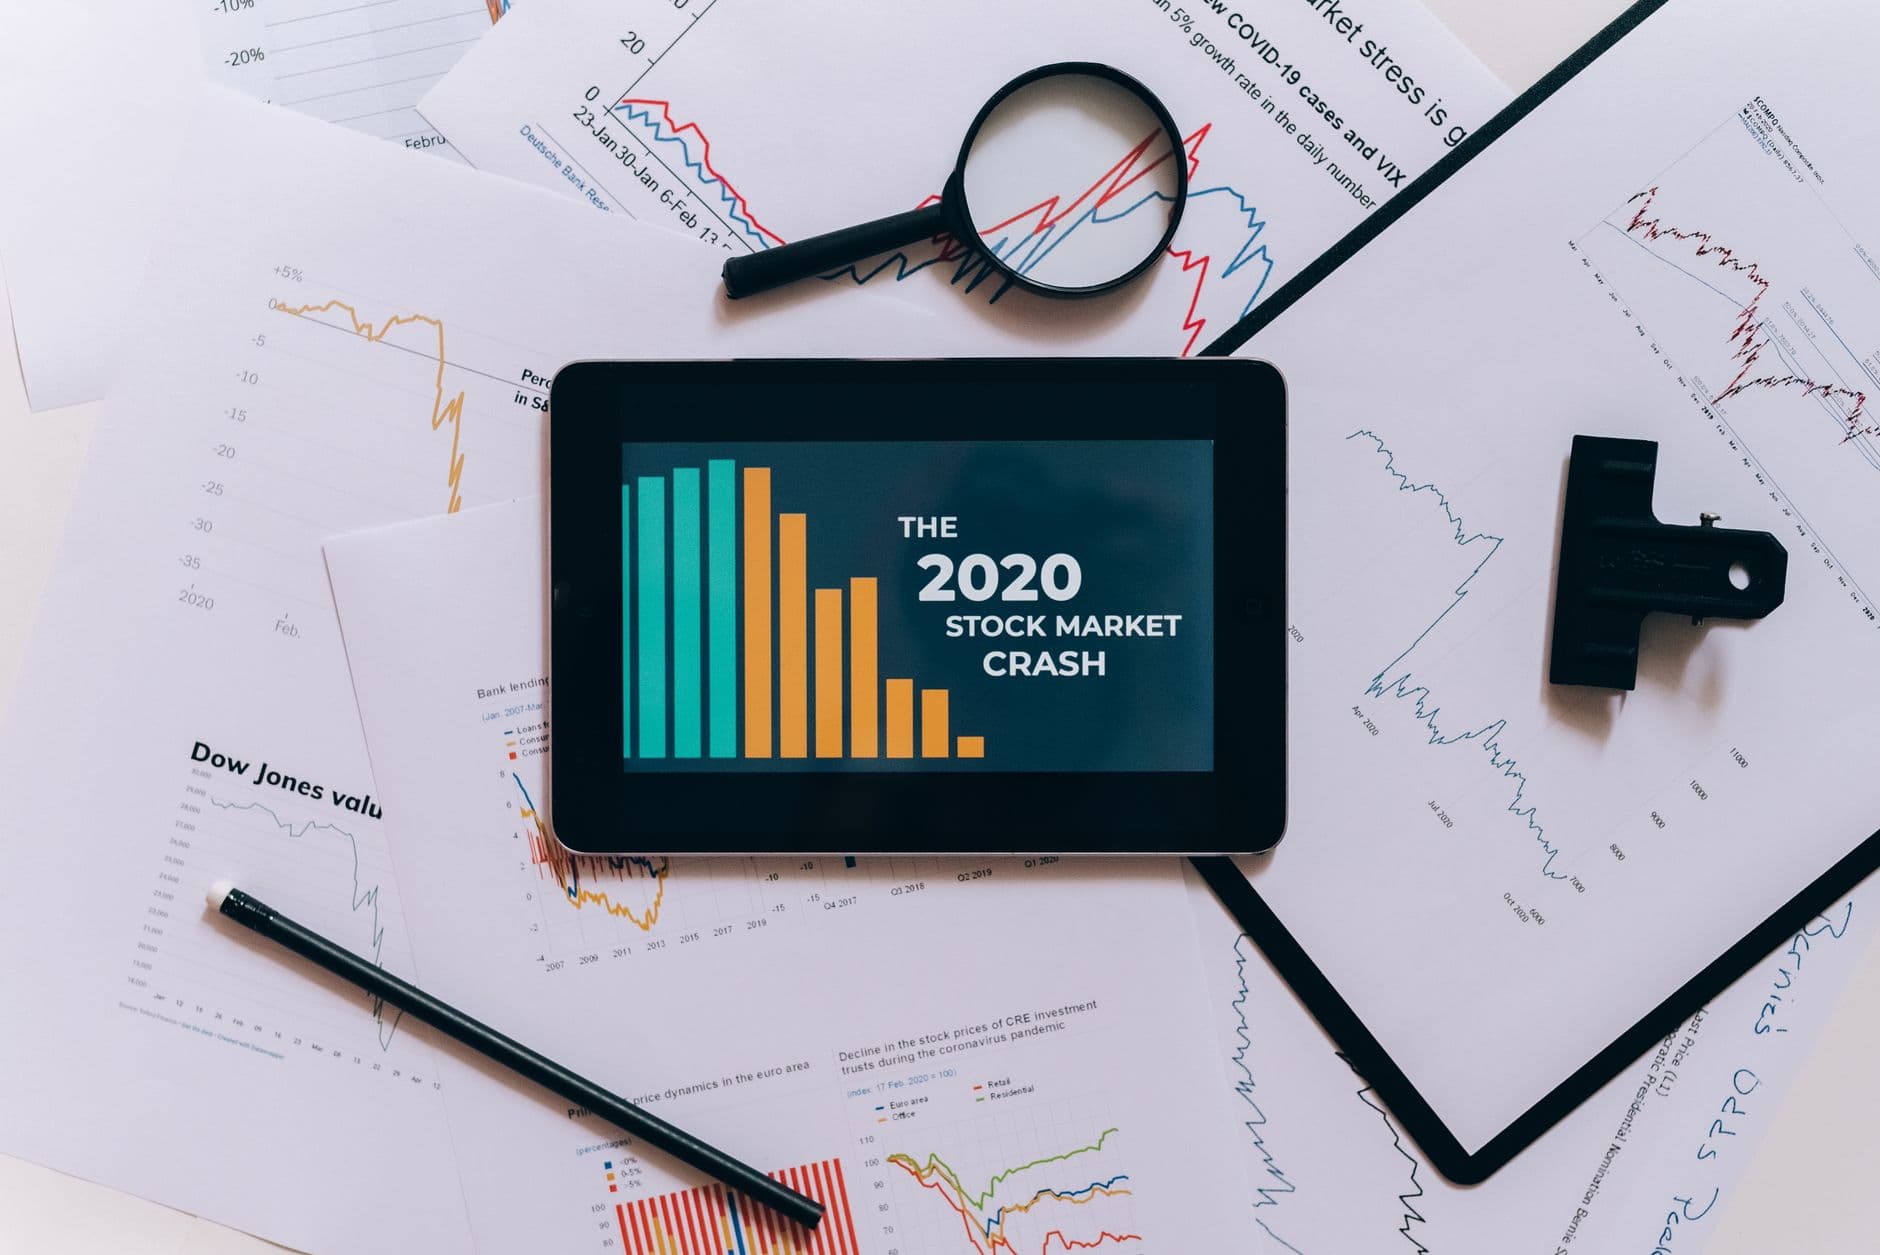
Calmar Ratio: Evaluating a Strategy by Its Worst Drawdown
The Calmar ratio compares annualized return to the worst observed drawdown. A blunt but telling metric, with its strengths and limitations.
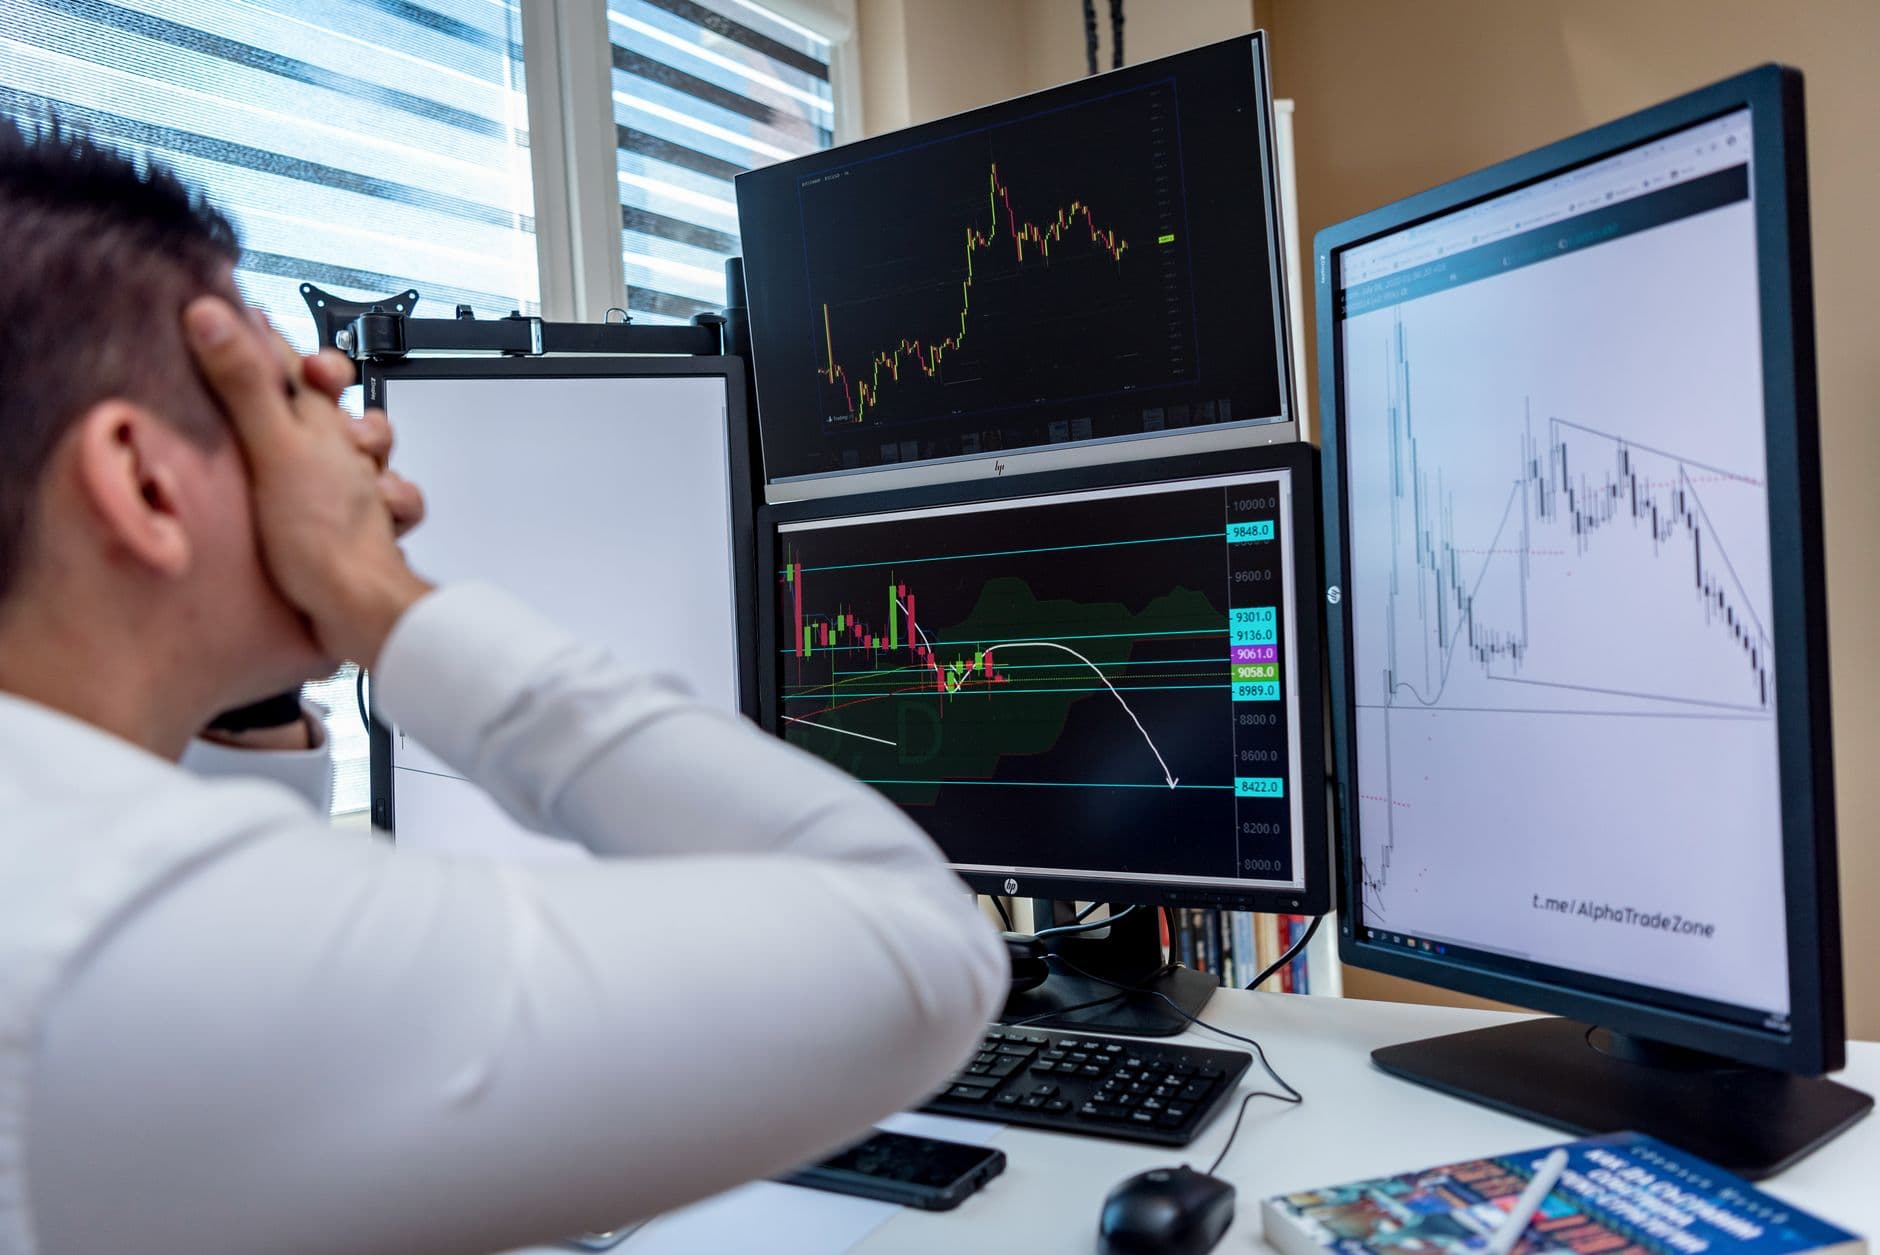
Maximum Drawdown: Why Psychology Matters More Than the Number
A 25% maximum drawdown looks acceptable on paper. In practice, it's often exactly where traders give up. Here's why, and how to prepare for it.

Walk-Forward Analysis: Validating a Backtest Without Falling Into Overfitting
Walk-forward analysis reproduces how a strategy would actually be re-optimized over time. Here's how it works and why it detects overfitting better than a simple in-sample/out-of-sample split.

Survivorship Bias in Backtesting: Why Your Results Are Probably Too Optimistic
Testing a strategy only on companies and funds still active today artificially inflates performance. Here's how to detect and correct survivorship bias.

Portfolio Rebalancing: The 5/25 Rule Explained
Why your allocation drifts over time, and how the 5/25 rule helps decide when to rebalance without overreacting.
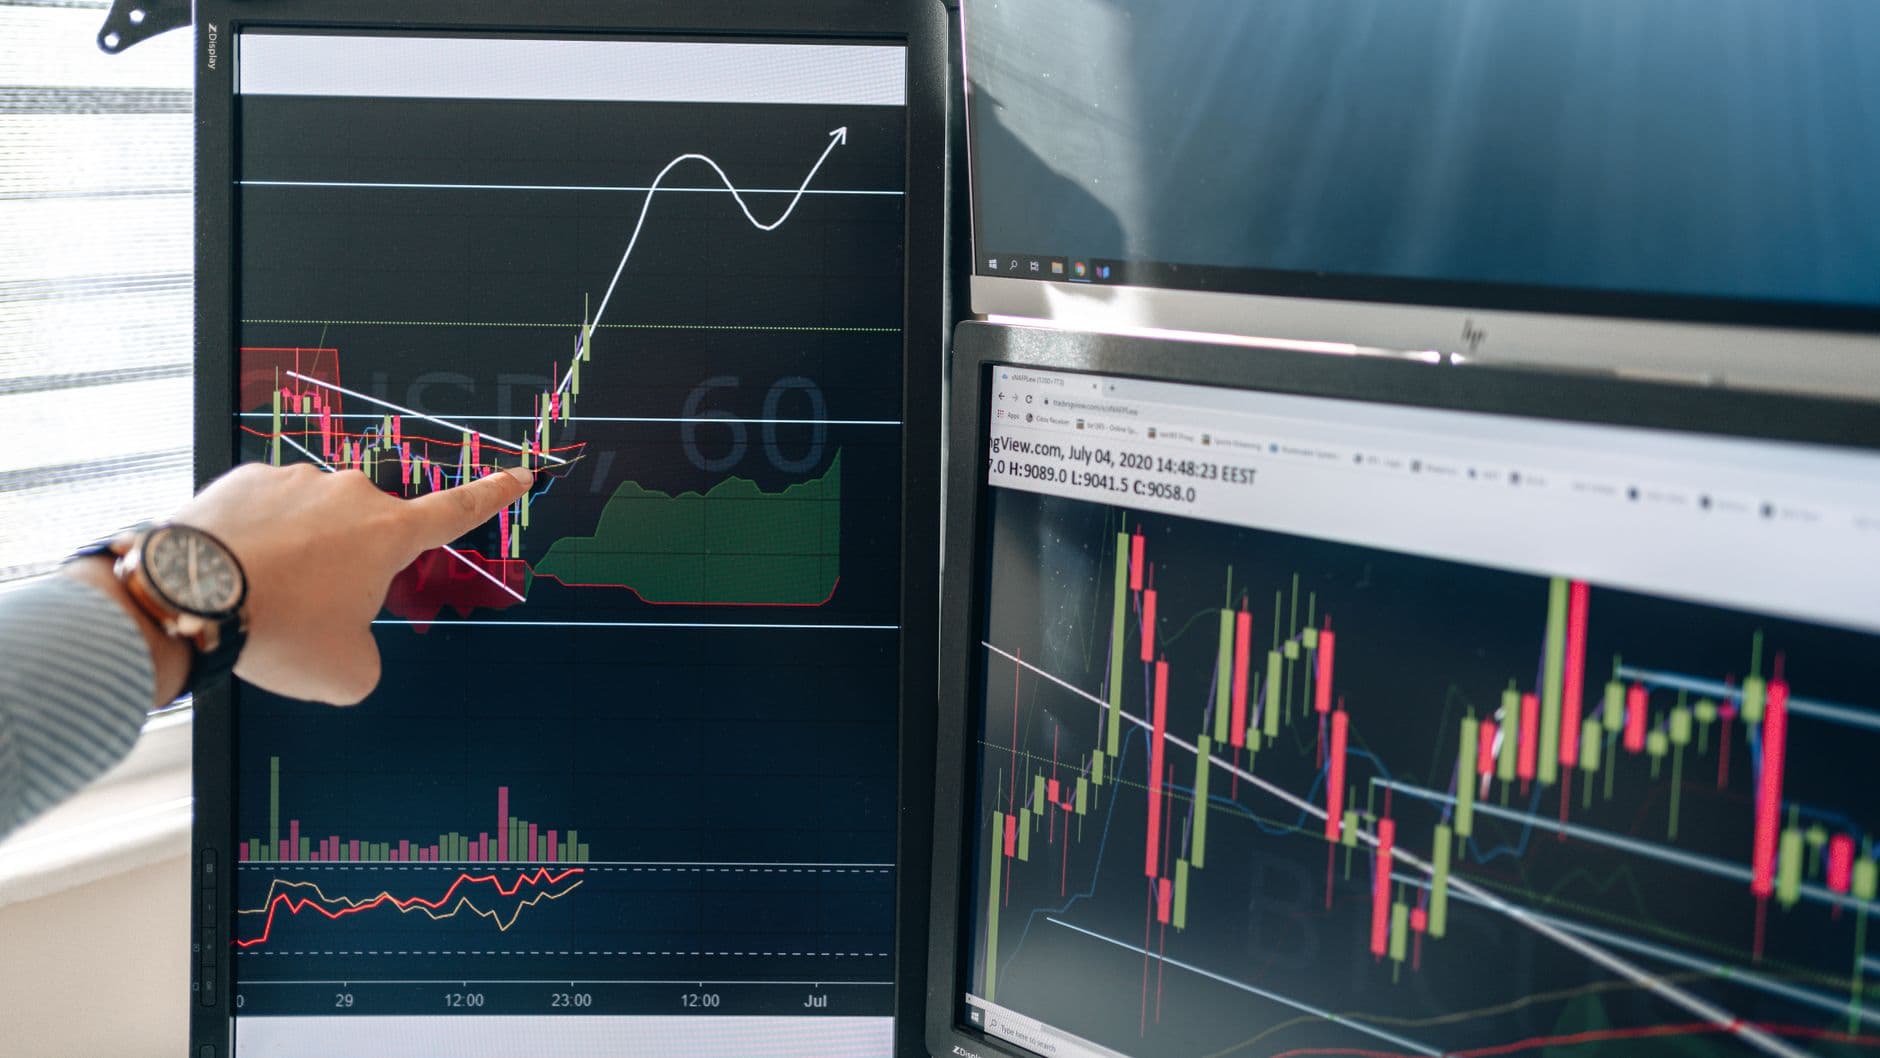
Position Sizing: Alternatives to the Kelly Criterion
Fixed, fractional, volatility-based, or the 2% rule: a tour of position sizing methods beyond the Kelly criterion.

Overfitting in Machine Learning Trading: Why So Many Models Fail
A model that predicts the past perfectly and collapses in live conditions: overfitting is the number-one trap in machine learning applied to trading. Understanding why, and how to guard against it.

Currency Risk in Your Portfolio: Understanding and Managing FX Exposure
Investing internationally mechanically exposes a portfolio to currency swings that can amplify or wipe out the underlying assets' performance. A close look at portfolio currency risk, with numeric examples.

ETF Taxation: Tax-Advantaged Wrapper vs Ordinary Brokerage Account
Tax-advantaged wrapper or ordinary brokerage account: the investment vehicle you choose directly shapes how your ETFs are taxed. A general, educational overview of the core principles — always to confirm with a professional.

Confirmation Bias in Trading: How It Skews Your Decisions
Confirmation bias pushes discretionary traders to see only what validates their position. A breakdown of the mechanism and concrete techniques to guard against it.

Omega Ratio: A Compelling Alternative to Sharpe
The Omega ratio uses the entire return distribution instead of just mean and variance. Explanation, a worked example, and the limitations of this underused measure.
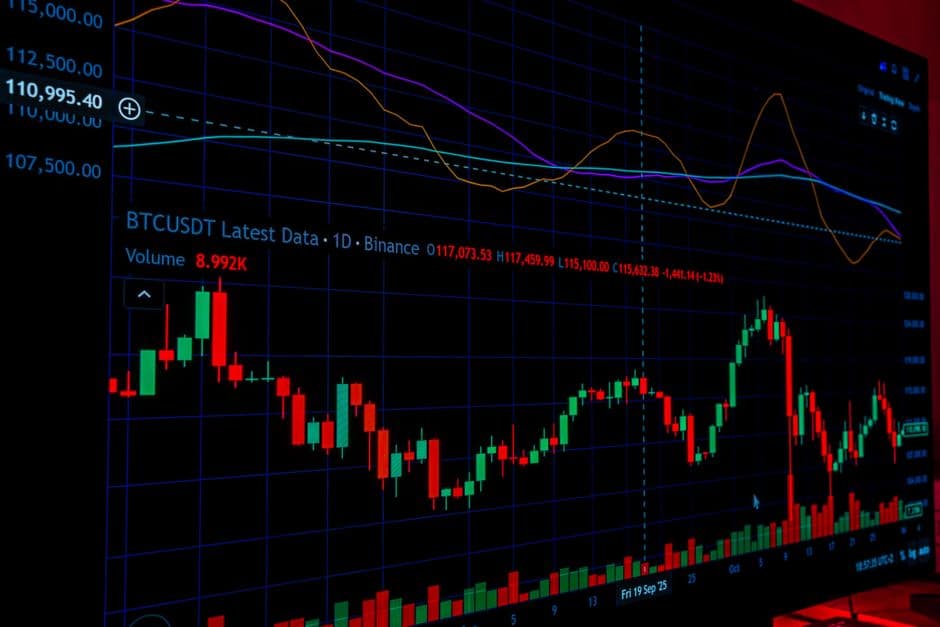
Backtesting a Crypto Strategy: The Pitfalls Specific to Digital Asset Markets
Crypto backtests suffer from biases rarely seen in equity markets: ignored funding rates, underestimated slippage, price histories from exchanges that no longer exist. Here's what makes a crypto backtest misleading, and how to correct for it.
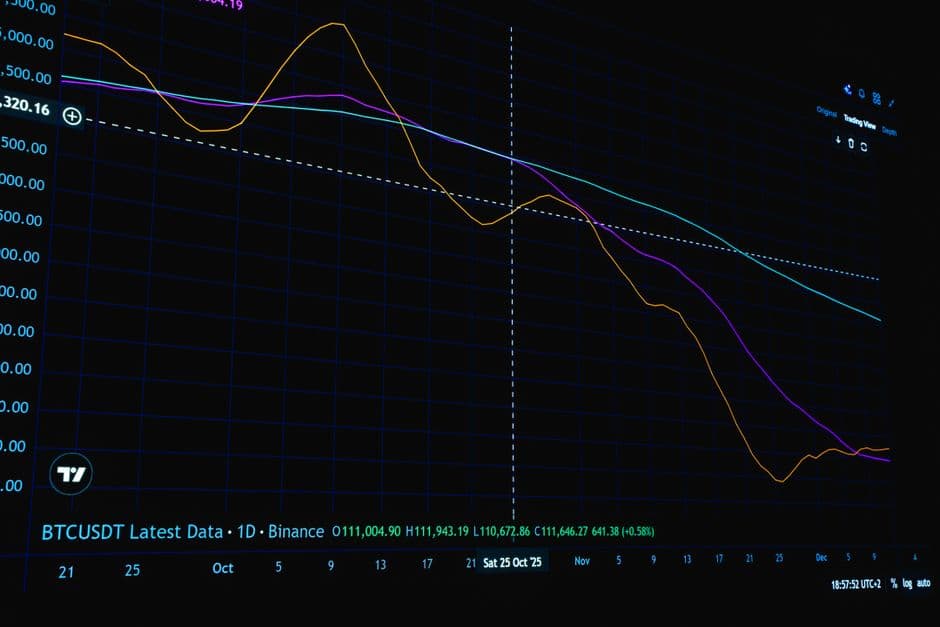
Crypto Position Sizing: Why the Classic Kelly Criterion Fails Against Extreme Volatility
The Kelly criterion assumes returns whose distribution remains reasonably stable. Fat tails and flash crashes in crypto markets violate this assumption head-on, with concrete consequences for position sizing.

ESMA Leverage Regulation on CFDs/Forex: What Changed for European Retail Traders
Since 2018, ESMA has capped the leverage available to European retail traders on CFDs and Forex. Here's what these caps concretely change for position sizing, and why they exist.

Regulatory Reporting for Quant Funds: Form PF, 13F, and the Line With Strategy Secrecy
US quantitative funds must disclose part of their positions and risk exposure through regulatory filings — without revealing their alpha. Here's how that line is drawn in practice.

Robo-Advisors: How Automated Allocation Actually Works
Behind a robo-advisor's simplified interface lies an allocation mechanism based on well-established quantitative models. Here's what actually happens between your risk profile questionnaire and your portfolio's final allocation.
Inverted Yield Curve: What Does It Really Say About an Upcoming Recession?
Yield curve inversion is one of the most cited macro indicators as a recession predictor. Its track record is impressive, but its lag and practical reliability deserve nuance before drawing an allocation decision from it.

Why Backtest Results Fail in Live Trading: 7 Hidden Pitfalls
Seven concrete, well-documented reasons backtested performance fails to replicate live, from survivorship bias to overfitting, with mitigations for each.
Walk-Forward Analysis vs Cross-Validation for Time Series
Why K-Fold cross-validation leaks future data in trading backtests, and how walk-forward analysis and CPCV provide a valid alternative for time series.

Survivorship Bias in Backtesting: Why It's a Fatal Flaw
Understand how survivorship bias inflates equity backtest returns and how point-in-time data and delisting adjustments fix it.
Modeling Slippage and Commissions in Algorithmic Backtests
Learn why zero-cost fill assumptions inflate backtests and how to model slippage, spread, and commissions realistically in Python.

Sharpe Ratio vs Sortino Ratio: Formulas and When to Use Each
A rigorous comparison of the Sharpe and Sortino ratios, with formulas, Python code, and a clear framework for choosing the right risk-adjusted metric.

Monte Carlo Simulation for Trading Strategies in Python
Learn how Monte Carlo simulation in Python reveals the true drawdown risk of a trading strategy beyond a single historical backtest path.

The Kelly Criterion in Trading: Formula and Fractional Sizing
The Kelly criterion formula explained: derivation, why full Kelly fails under real-world fat tails, and why fractional Kelly sizing is used instead.

How to Avoid Overfitting in Algorithmic Trading Strategies
Practical techniques to reduce overfitting in algorithmic trading: temporal splits, parameter reduction, regularization, and heatmap diagnostics.
How to Calculate Maximum Drawdown and Time Underwater in Python
Learn to calculate maximum drawdown and time underwater in Python with pandas, including a complete script, plots, and why duration matters as much as depth.

Best Python Libraries for Backtesting Trading Strategies
A technical comparison of VectorBT, Backtrader, Zipline-Reloaded and QuantConnect/LEAN for Python backtesting, covering architecture, speed and realism trade-offs.