Maximum Drawdown: Why Psychology Matters More Than the Number
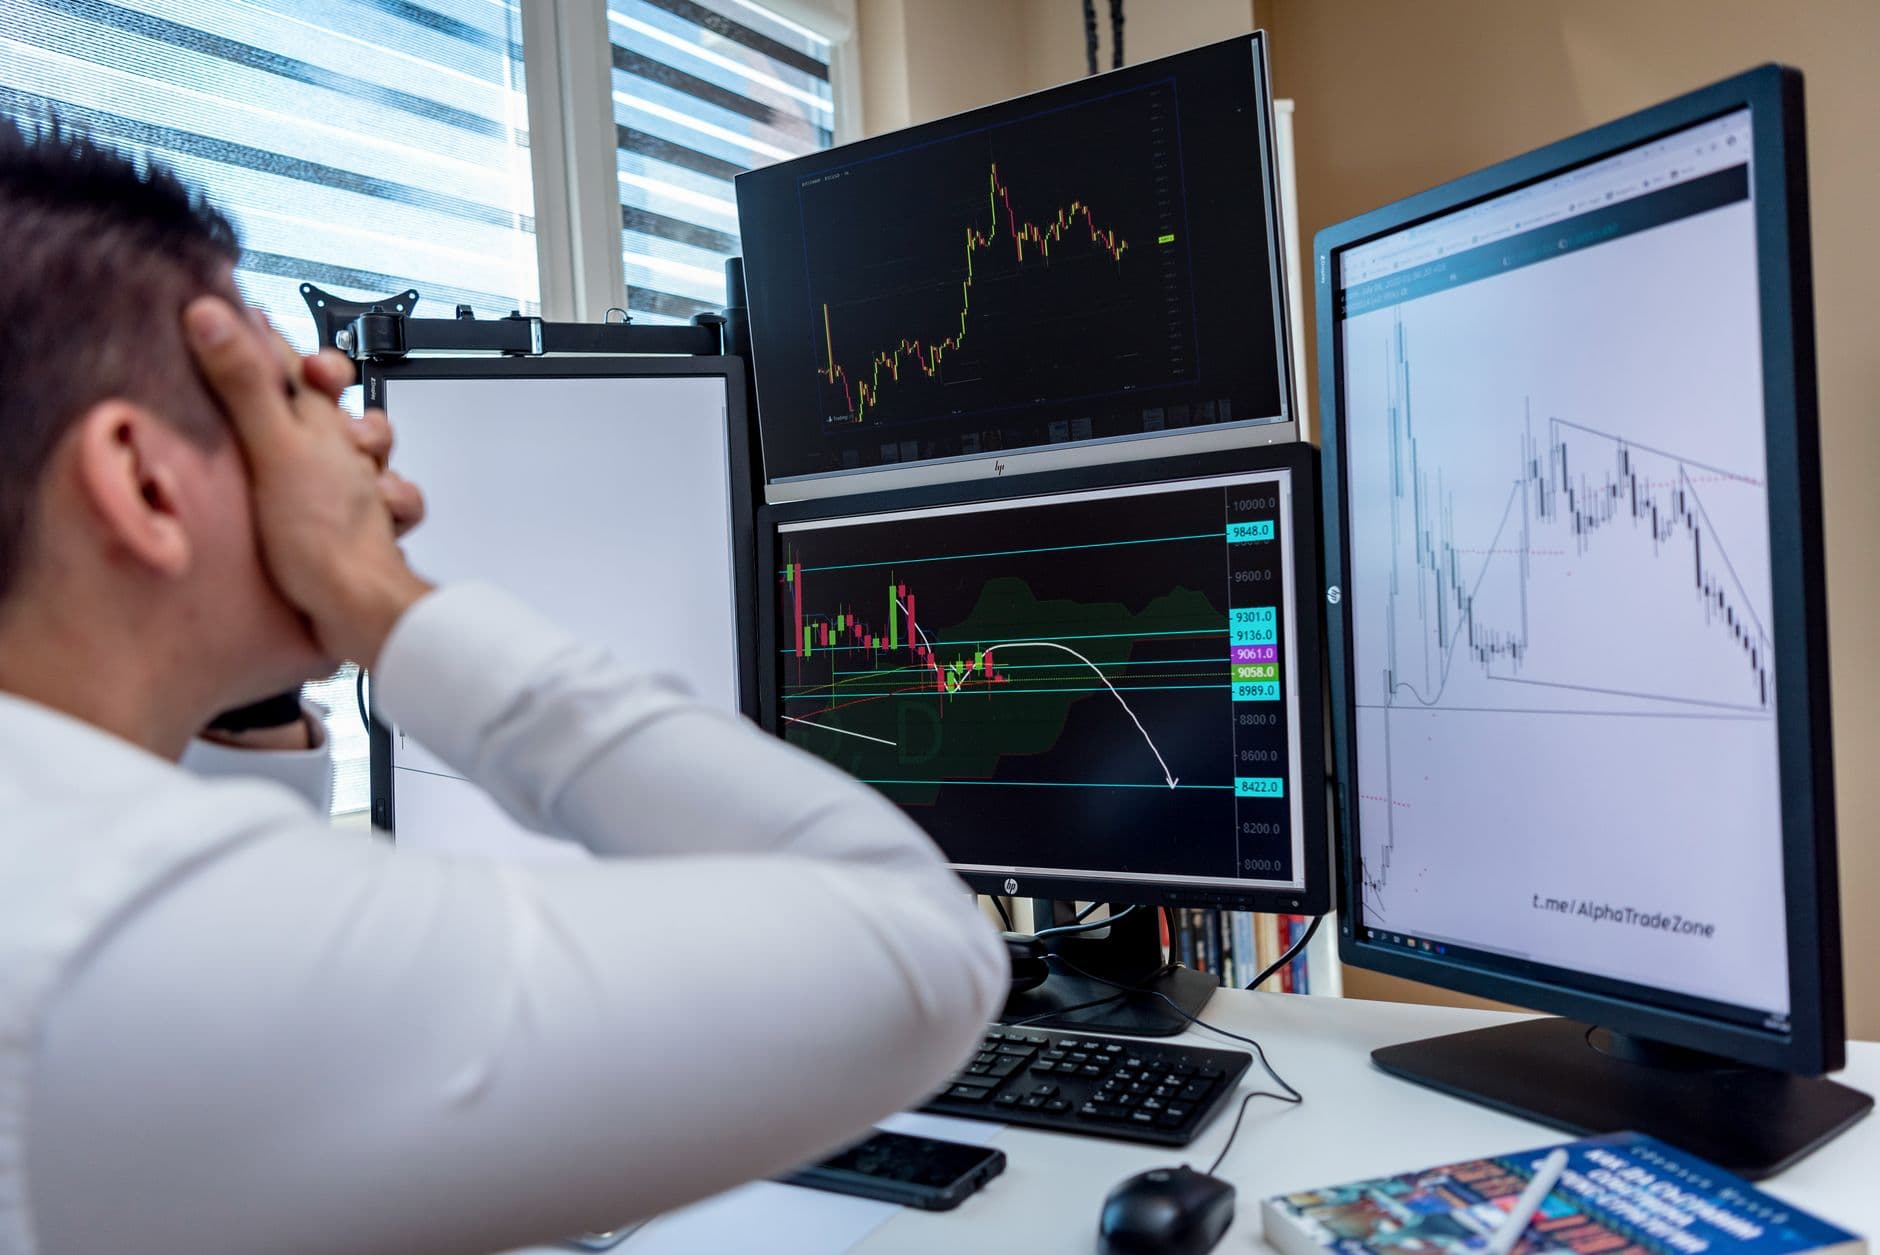
Maximum drawdown has a mathematically simple definition: it is the largest percentage decline between a capital peak and the trough that follows it. A backtest can display a maximum drawdown of 25% or 30% with purely theoretical elegance. In practice, that number hides the real challenge of trading discipline.
Because a drawdown that looks 'acceptable' on paper is almost always the exact moment when a real trader, with real money, abandons a strategy that would have eventually recovered. This article explores the gap between theoretical maximum drawdown and what a human being can actually stomach, and offers concrete techniques for holding the line.
What Maximum Drawdown Really Measures
Technically, maximum drawdown measures only one episode of loss, the worst one observed over a given period. It says nothing about the frequency of smaller losses, nor about how long it takes to recover. But its real, often overlooked, function is to serve as a psychological stress test before it is even a statistical one.
A quant manager presenting a backtest with a 22% maximum drawdown generally thinks in terms of probability and model robustness. The client or trader living that same drawdown in real time, however, thinks in terms of months of lost salary and sleepless nights.
The Gap Between Backtested Drawdown and What a Human Can Stomach
Behavioral finance research documents a robust phenomenon: loss aversion means the pain felt from a loss is roughly twice as intense as the pleasure felt from an equivalent gain. A 25% drawdown is therefore not experienced as '25% less,' but as an emotionally disproportionate ordeal.

Why Capitulation Happens Near the Bottom
It is precisely near the trough of the drawdown, at the moment the strategy is statistically closest to recovering, that psychological pressure is at its peak. The trader has already absorbed several months of losses, doubts the model, and it is at that exact moment — often the worst possible one — that they cut the strategy or drastically reduce position size, right before the rebound.
This capitulation-near-the-bottom phenomenon is not a rare anomaly: it is a documented, recurring behavioral pattern, which explains why so many retail investors structurally underperform the very strategies they chose to follow.
Gain required to recover a loss
The Gulf Between Backtested Drawdown and Lived Experience
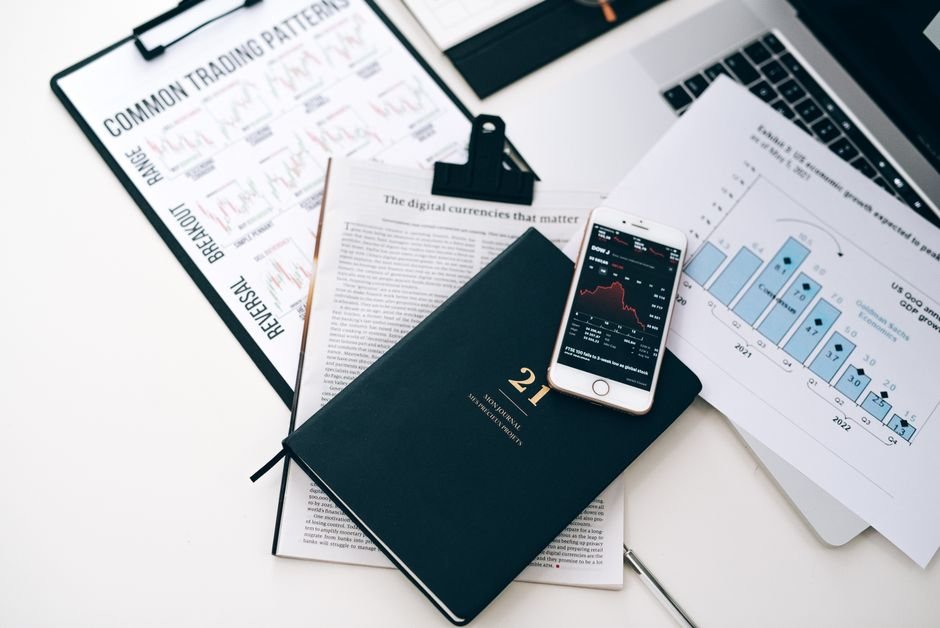
A backtest is built with hindsight: we already know the strategy eventually recovered. That hindsight changes everything. In real time, no one knows whether the ongoing drawdown is the start of a normal correction or a sign the strategy has stopped working.
This fundamental uncertainty is what the backtested maximum drawdown number never captures: it presents an already-known trajectory as if it were instantly legible in real time, creating a systematic gap between theoretical expectation and lived experience.
Concrete Techniques for Holding a Strategy Through a Drawdown
The first technique is to define position-sizing rules in advance, before the very first trade, and to formally commit never to change them mid-drawdown under the pressure of emotion. A rule written before the storm is worth infinitely more than a decision made in the middle of doubt.

The second is to put in place risk-reduction rules automatically triggered by the drawdown level itself: for instance, halving position size after a 15% drawdown, rather than letting a discretionary, emotional decision intervene at the worst possible moment.
The Role of Keeping a Trading Journal
The third technique, often underrated, is rigorously keeping a trading journal that documents not just the trades but also the trader's emotional state during drawdown phases. Rereading, later, one's own panicked notes from a previous drawdown that eventually resolved is one of the most effective tools for defusing panic during the next one.
Reducing Severity Rather Than Just Measuring It
Beyond behavioral techniques, certain position-sizing approaches, such as a conservative Kelly fraction, reduce the very severity of drawdowns rather than simply enduring and measuring them afterward. The point here is not to detail the Kelly fraction calculation, already covered elsewhere on this blog, but to underline the principle: a better-calibrated position size upstream mechanically limits the magnitude of losses downstream.
In practice, this means the same trading signal, applied with a more conservative position size than the theoretical maximum allowed, produces a noticeably lower maximum drawdown for an often minimal sacrifice in return, which directly improves the odds that the trader stays the course to the end of the strategy.
Conclusion
Maximum drawdown is not just a risk statistic: it is the true discipline test of a trading strategy. Anticipating the pain, setting rules before the storm, and prudently calibrating position size are the best tools for avoiding capitulation at the worst possible moment. TrueVerdikt's simulation tools at /outils let you concretely visualize the impact of position sizing on your drawdowns before you live through them for real.
From theory to practice
Measure and control a strategy's risk: drawdown, VaR, Sortino, Calmar and Omega ratios, position sizing and the Kelly criterion.
Analyse portfolio risk