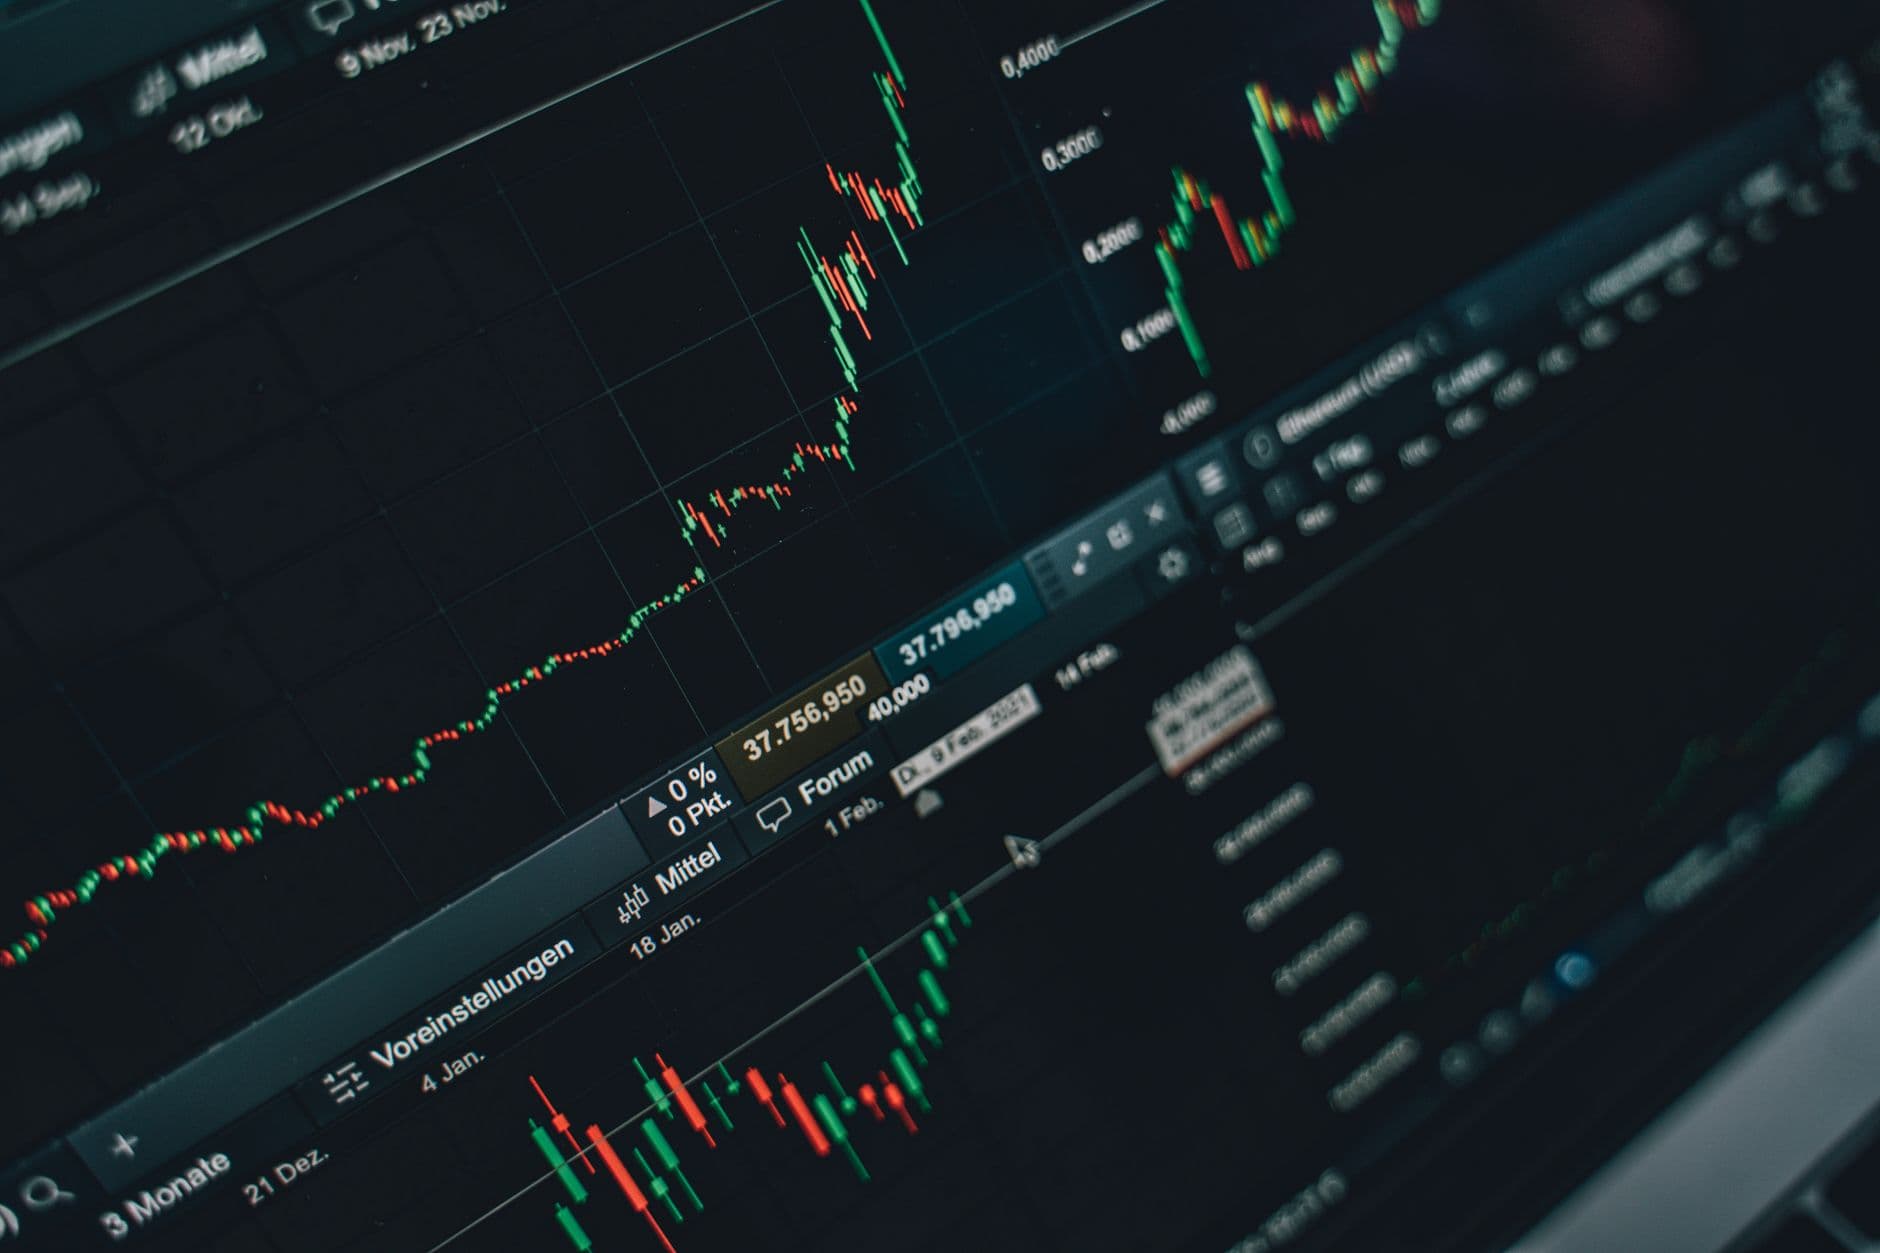
Why Backtest Results Fail in Live Trading: 7 Hidden Pitfalls

A backtest that shows an impressive Sharpe ratio is not evidence that a strategy will perform well going forward — it is a hypothesis that has survived one specific historical test. The gap between backtested and live performance is one of the most studied problems in quantitative finance, and it rarely comes down to a single dramatic error. More often it is the accumulation of several small, well-documented methodological pitfalls, each individually plausible-looking, each quietly inflating the reported result. Below are seven of the most common, each with a concrete mechanism and a specific mitigation.
1. Selection bias and survivorship bias in the tested universe
If you backtest a strategy against "the S&P 500" using today's constituent list, you are implicitly excluding every company that was delisted, acquired, or went bankrupt during your test window. Those companies' returns — often catastrophic — never enter your sample, which mechanically inflates the average return and understates the tail risk of the universe you claim to be testing.
Mitigation: use point-in-time constituent data that reflects what was actually in the index or universe on each historical date, not a lookup of the current membership list applied retroactively. Data vendors that specialize in point-in-time datasets, or platforms like QuantConnect that bundle this by default, exist specifically to close this gap.

Photo: AlphaTradeZone (Pexels)
2. Curve-fitting to historical noise
Given enough free parameters, any historical price series can be fit almost perfectly — the fit is capturing noise specific to that sample, not a persistent structural relationship. Marcos López de Prado's "Advances in Financial Machine Learning" devotes substantial attention to this failure mode, and David H. Bailey's research on backtest overfitting — including the Probability of Backtest Overfitting and the Deflated Sharpe Ratio — provides a formal statistical framework for detecting it rather than relying on intuition.
The Deflated Sharpe Ratio is particularly useful here because it explicitly penalizes a reported Sharpe ratio for the number of independent trials that were run to find it, rather than treating the single best result as if it were the only test performed.
Mitigation: favor strategies with a small number of parameters grounded in an economic or statistical rationale over strategies with many free parameters tuned purely to maximize historical fit. Reserve a genuinely untouched out-of-sample period, and correct the reported Sharpe ratio for the number of configurations tested before accepting it.
3. Look-ahead bias and data leakage
This is the most mechanically simple pitfall and also one of the easiest to introduce by accident. It occurs whenever a backtest uses information that would not actually have been available at the moment a decision is simulated — for example, using a day's closing price to generate a signal that is then assumed to execute at that same day's close, or using dividend- and split-adjusted closing prices that incorporate corporate action data only finalized after the fact.
import pandas as pd
import numpy as np

df = pd.DataFrame({
    "close": [100.0, 101.5, 99.8, 102.3, 103.1, 101.9, 104.0]
})

# INCORRECT: signal computed from today's close is used to compute
# today's return, implying the trade executed before the close was known.
df["signal_buggy"] = (df["close"].pct_change() > 0).astype(int)
df["return_buggy"] = df["signal_buggy"] * df["close"].pct_change()
# This silently assumes perfect foreknowledge of the very bar being traded.

# CORRECT: shift the signal forward by one bar so that today's decision
# is only applied to tomorrow's return — the earliest point it could
# actually have been acted upon.
df["signal_correct"] = (df["close"].pct_change() > 0).astype(int)
df["position"] = df["signal_correct"].shift(1).fillna(0)
df["return_correct"] = df["position"] * df["close"].pct_change()

print(df[["close", "signal_correct", "position", "return_correct"]])
The buggy version and the corrected version can produce meaningfully different cumulative returns over a long backtest, and the buggy version will almost always look better — because it has quietly been given tomorrow's information today.
Mitigation: audit every feature and signal for the exact timestamp at which it would have been knowable, and enforce a strict shift between signal computation and position application, as shown above.

Photo: Johannes Plenio (Pexels)
4. Unrealistic liquidity and execution assumptions
Many backtests assume that an order fills entirely, instantly, at the exact historical closing or mid price, regardless of order size. In reality, larger orders move the price against the trader (market impact), bid-ask spreads widen during volatile periods exactly when a strategy is most likely to want to trade, and thinly traded instruments may not offer enough volume to fill a position at all.
Mitigation: model transaction costs explicitly — commissions, spread costs, and a market-impact function related to order size relative to average daily volume — rather than assuming frictionless execution. Event-driven backtesting engines that simulate order books and slippage models are structurally better suited to this than purely vectorized approaches.
5. The multiple-testing problem
If you test a thousand parameter combinations and report only the single best-performing one, you have not found evidence of a robust strategy — you have found the combination that, purely by chance, best fit the noise in your specific historical sample. This is a direct application of the multiple comparisons problem from statistics, and it is precisely the mechanism the Deflated Sharpe Ratio was designed to correct for: as the number of independent trials increases, the expected maximum Sharpe ratio among purely random strategies also increases, purely as a function of sample size and number of trials — with zero genuine skill involved.
Our companion article on this topic, /blog/data-snooping-ratio-de-sharpe, walks through the statistical mechanics of this correction in more detail.
Mitigation: track and disclose the total number of configurations tested, apply a Sharpe ratio correction proportional to that count, and treat any result that only survives at the uncorrected number as provisional rather than validated.
6. Regime change and non-stationarity
Financial markets are not stationary processes. A strategy calibrated during a low-interest-rate, low-volatility regime may rely, often invisibly, on structural relationships that simply do not hold once monetary policy, market microstructure, or investor composition shifts. Nassim Taleb's "The Black Swan" is the most widely cited popular treatment of how models calibrated to a historical sample can badly underestimate the probability and impact of regime-breaking events that fall outside that sample.
Mitigation: test strategies across multiple distinct historical regimes (different volatility environments, different rate cycles, at least one major crisis period) rather than a single continuous window, and build in monitoring that can detect when live performance is statistically diverging from backtested expectations rather than assuming the original fit remains valid indefinitely.

Photo: vasu jamwal (Pexels)
7. Implementation and software bugs
Off-by-one timing errors are extraordinarily common and easy to miss on casual code review, precisely because the backtest still runs and produces a plausible-looking equity curve — it simply produces the wrong one. The example in pitfall 3 above is one specific case of this broader category, but the same class of bug appears in many forms: an incorrect rolling-window boundary that includes today's bar when it should not, a portfolio rebalancing function that double-counts a position, or a fee calculation applied to the wrong side of a trade.
Mitigation: write unit tests for signal generation and portfolio accounting logic independently of the full backtest, verify a handful of trades by hand against the raw price data, and cross-check aggregate statistics (total number of trades, total turnover, total fees paid) against manually computed expectations before trusting the headline performance number.
From backtest to live: the filters a strategy must pass
- 1
Clean data
Point-in-time, survivorship-free universe
- 2
Honest testing
Out-of-sample, corrected for multiple trials
- 3
Realistic costs
Slippage, commissions and liquidity limits
- 4
Paper trading
Same code, live data, no capital
- 5
Small live size
Scale only once live matches expectations
Putting it together
None of these seven pitfalls requires bad faith or carelessness to occur — most arise from reasonable-looking default choices in backtesting libraries or a natural eagerness to see a strategy validated after significant research effort. What separates a defensible backtest from a misleading one is not the absence of any single mistake, but a disciplined, repeatable process that checks for all seven systematically rather than relying on the headline Sharpe ratio alone.
Readers building this kind of checklist into their own research workflow may find it useful to formalize the process rather than relying on memory or ad hoc review each time a new strategy is tested — this is the specific gap TrueVerdikt's backtest-audit tool at /outils is built to close, by statistically scanning a submitted backtest for exactly these overfitting and data-leakage signatures. TrueTrueVerdikt's ebooks on risk management and clean backtesting methodology go further into the underlying statistical reasoning for readers who want a structured, in-depth treatment rather than a single article's summary.
Disclaimer: This article is provided for educational and informational purposes only. It does not constitute financial, investment, or trading advice. Trading and investing involve substantial risk of loss. Past performance, backtested or live, is not indicative of future results. Always conduct your own research and consult a licensed financial advisor before making investment decisions.
From theory to practice
Validate a strategy before risking capital on it: data-snooping, overfitting, walk-forward analysis, survivorship bias and the Deflated Sharpe Ratio.
Analyse a backtest