Backtesting a Crypto Strategy: The Pitfalls Specific to Digital Asset Markets
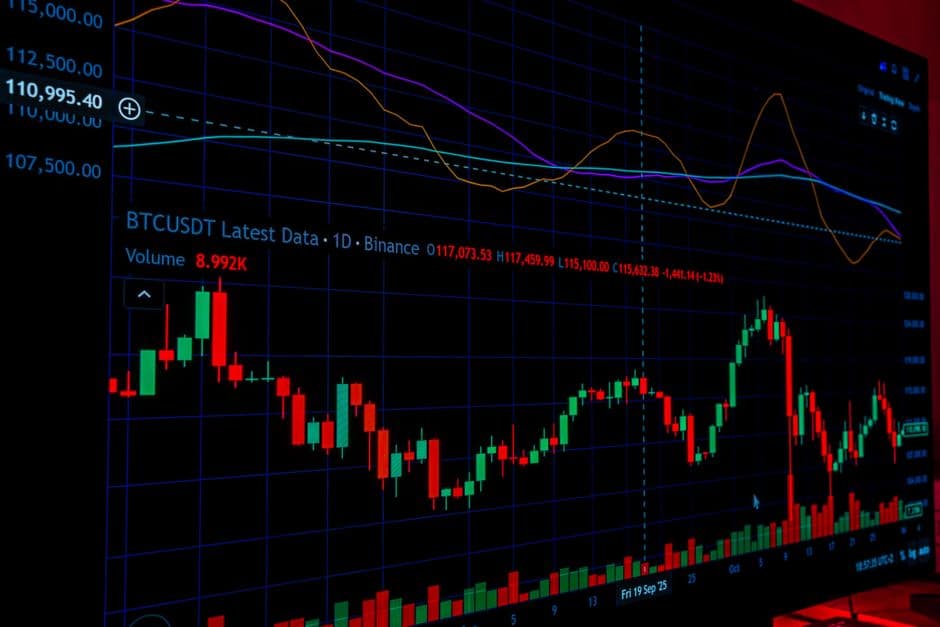
A backtest of a Bitcoin or Ethereum strategy showing an impressive Sharpe ratio often hides methodological biases that are absent or marginal in traditional equity markets. The crypto market is younger, more fragmented across exchanges, and structurally more prone to low-quality data — which makes a naive backtest particularly optimistic.
A misleading price history
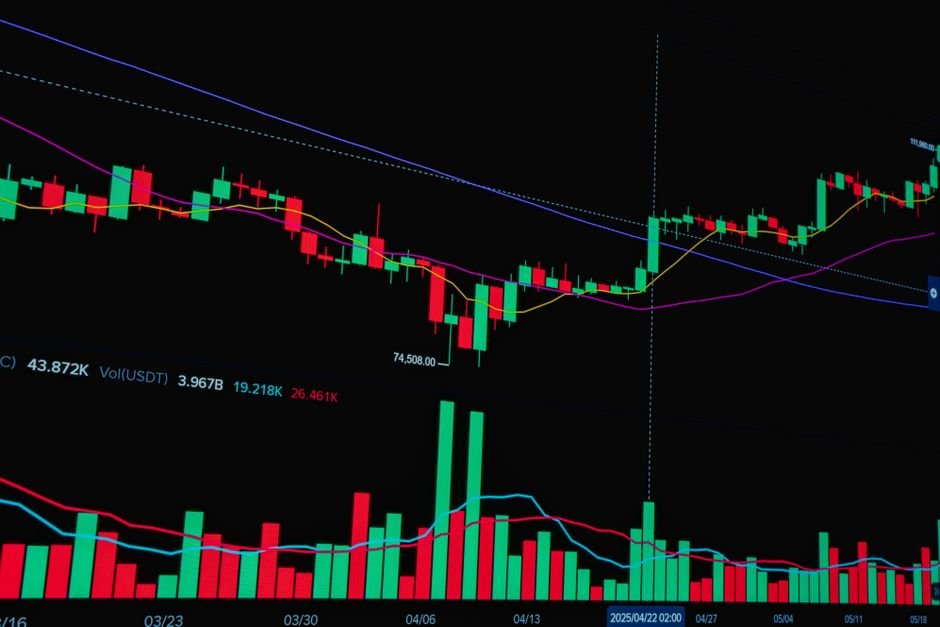
Many exchanges that existed between 2017 and 2022 have closed, merged, or been acquired (Mt. Gox, FTX, early Bitfinex). Aggregated price datasets used to backtest a strategy often survive by silently excluding these defunct platforms and delisted tokens — a survivorship bias that mechanically inflates the apparent performance of a strategy tested over several years.
The same problem exists for individual tokens: thousands of projects have lost all liquidity or been removed from exchanges. A backtest that only tests on cryptocurrencies still active today silently ignores all failures, which biases upward any token selection or rotation strategy.
Funding rate, an invisible cost in naive backtests

Strategies using perpetual futures contracts are exposed to the funding rate: a periodic payment (typically every 8 hours) between long and short positions, designed to anchor the perpetual's price to the spot price. This cost can amount to several annualized percentage points, positive or negative depending on the position's direction and the prevailing market sentiment.
A backtest that simulates positions on perpetual futures without incorporating the actual funding rate history systematically overstates the net performance of a directional strategy held for several days or weeks — the error compounds the longer the position is held in a market where funding is structurally unfavorable to its direction.
Slippage and fragmented liquidity across exchanges
Unlike a stock listed on a single regulated exchange, a cryptocurrency trades simultaneously on dozens of exchanges with independent order books and highly uneven liquidity. A backtest using an aggregated closing price (often a volume-weighted average across platforms) implicitly assumes perfect execution at that average price — an unrealistic assumption as soon as position size exceeds the order book depth on the actual platform used.
Real slippage depends heavily on prevailing volatility: during a sharp move, the gap between the displayed price and the actual execution price can exceed several percentage points on mid-cap tokens, an effect almost entirely absent from simulations that apply a fixed, modest slippage borrowed from equity markets.
Trading halts and tail-event volatility
Crypto markets never close, unlike equity exchanges that halt trading during extreme moves (circuit breakers). This continuity amplifies the scale of cascading moves during chain liquidations on leveraged products — a phenomenon specific to crypto markets that few generic backtesting engines model correctly, for lack of granular forced-liquidation history.
On-chain data: a complementary source of truth
Beyond the price data provided by exchanges, the blockchain itself is an independent, verifiable source of information: every transaction, every fund movement between addresses, every interaction with a DeFi protocol is publicly and immutably recorded. Cross-checking volumes reported by an exchange against actual on-chain activity helps detect wash trading — fictitious transactions between accounts controlled by the same entity to artificially inflate displayed volume, a practice documented on several historically less-regulated exchanges.
A backtest relying exclusively on off-chain volumes (those reported by the exchange) risks overstating actually available liquidity, particularly on mid-cap tokens where wash trading can account for a significant share of apparent volume. On-chain data, though more costly to process and aggregate, offers an additional safety net to confirm that a strategy tested on artificially inflated volume would remain executable under real conditions.
Adapting the walk-forward validation window to crypto
Walk-forward validation, which periodically re-optimizes a strategy on a rolling window and then tests it out-of-sample on the following period, must be calibrated differently for crypto than for equities: market regimes (bullish, bearish, high-volatility sideways) succeed one another on markedly shorter timescales, often a few months rather than several years.
A re-optimization window borrowed from equity market standards (for instance, annual re-estimation) risks freezing a crypto strategy on a market regime already obsolete by the time it is actually deployed. Conversely, too short a window exposes to the opposite risk: overfitting the model to short-term noise rather than a genuinely persistent statistical signal. Purging overlap periods between training and testing windows remains a necessary precaution, but insufficient alone if the time split doesn't reflect the crypto market's own cyclicality.
To rigorously test a crypto strategy while accounting for the funding rate, realistic slippage, and validation windows that exclude survivorship bias, the backtesting tools available at /outils let you configure these specific parameters instead of relying on a generic backtest borrowed from equity markets.
From theory to practice
Validate a strategy before risking capital on it: data-snooping, overfitting, walk-forward analysis, survivorship bias and the Deflated Sharpe Ratio.
Analyse a backtest