The True Cost of Mutual Fund MERs in Canada: Series A vs. Series F vs. TSX-Listed ETFs Across the Big 6 Banks & Desjardins
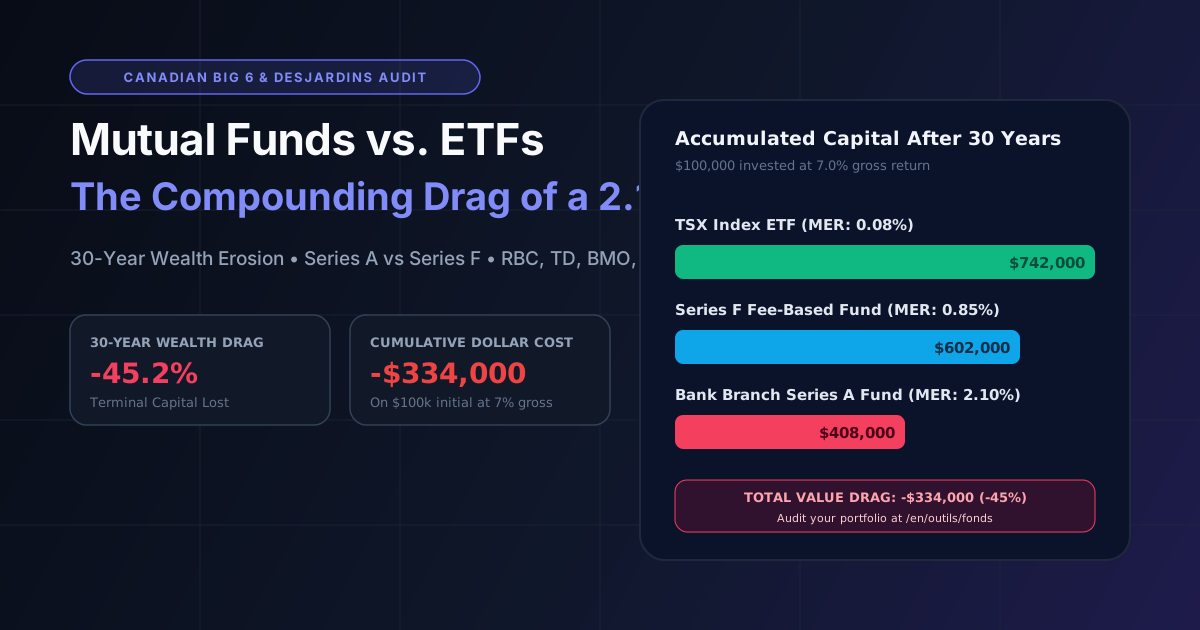
Canadian retail investors pay some of the highest mutual fund Management Expense Ratios (MERs / RFG) in the developed world. While a broad-market index Exchange-Traded Fund (ETF) listed on the Toronto Stock Exchange (TSX)—such as XIC.TO (iShares Core S&P/TSX Capped Composite) or ZCN.TO (BMO S&P/TSX Capped Composite)—charges an annual MER of just $0.06%$, the flagship Series A equity and balanced mutual funds distributed across the branches of Canada's seven major financial institutions (RBC, TD, BMO, Scotiabank, CIBC, National Bank, and Desjardins) routinely charge between $1.75%$ and $2.35%$ per year.
To an everyday saver, a $2.00%$ fee sounds modest—often mistaken for $2%$ of the year's investment profit. In reality, a mutual fund's MER is deducted daily from 100% of your total portfolio balance (principal plus all accumulated gains), in bull markets and bear markets alike. Over a 25- to 30-year retirement horizon inside an RRSP or TFSA, a $2.00%$ annual MER differential quietly confiscates $35%$ to $46%$ of your terminal investment wealth—frequently costing a middle-class Canadian household between $150,000 and $330,000 in lost retirement capital.
In this institutional study, we dissect the regulatory anatomy of Canadian mutual fund fees (pure management fee, trailing commission, operating expenses, GST/HST/QST, and Trading Expense Ratio—TER), compare Series A, Series F, and TSX-listed ETFs across Canada's Big 6 banks and Desjardins, examine CRM2 and Total Cost Reporting (TCR) rules, and present the exact compound-erosion equations behind our Canadian Mutual Fund & ETF Fee Comparator.
1. Regulatory Anatomy of a Canadian Fund Fee: MER + TER Breakdown
When you read the statutory Fund Facts (Aperçu du fonds) document required under National Instrument 81-101 of the Canadian Securities Administrators (CSA), the total annual cost deducted from a fund's Net Asset Value (NAV) consists of four distinct layers:
$$\text{Total Annual Cost (%)} = \underbrace{\text{Base Management Fee} + \text{Trailing Commission} + \text{Operating Costs} + \text{GST/HST/QST}}_{\text{Management Expense Ratio (MER / RFG)}} + \text{TER (RFO)}$$
1. The Base Management Fee (Frais de gestion de base)
Paid to the investment fund manager (e.g., RBC Global Asset Management, TD Asset Management, BMO Global Asset Management, Desjardins Investments) for portfolio management, macroeconomic research, risk oversight, and fund administration. For an actively managed Canadian equity or balanced mutual fund, this component typically ranges from $0.65%$ to $1.00%$.
2. The Embedded Trailing Commission (Commission de suivi — Series A)
In a Series A retail mutual fund (the default share class sold in bank branches and through commission-based mutual fund dealers), an additional $0.50%$ (fixed-income/conservative funds) to $1.00%$ (equity and growth funds) is extracted from your capital every year and paid to the distributing dealer for "ongoing advice"—even if you haven't spoken to a branch representative in years. Following the CSA's ban on deferred sales charges (DSC) and the prohibition of trailing commissions inside Order-Execution-Only (OEO / DIY discount brokerage) accounts implemented in June 2022, self-directed investors now have direct access to Series F (fee-based / no-trailer) mutual funds and TSX-listed ETFs that eliminate this $1.00%$ annual drag entirely.
3. Operating Expenses and Sales Taxes (GST / HST / QST)
Unlike capital gains or dividends, investment management services inside a mutual fund or ETF are subject to federal and provincial sales taxes (5% GST, 13% HST in Ontario, or 14.975% combined GST+QST in Quebec, weighted by the provincial residence of the fund's unitholders). Consequently, a mutual fund with $1.80%$ in pre-tax management and administration fees ends up charging an effective post-tax MER of $2.03%$ to $2.07%$.
4. The Trading Expense Ratio (TER / Ratio des frais d'opérations)
Reported separately from the MER on the Fund Facts sheet, the TER measures the institutional brokerage commissions paid by the fund when buying and selling underlying stocks:
- In a passive index ETF (
XIC.TO,ZCN.TO,XBB.TO), portfolio turnover is minimal and the TER is $0.00%$ to $0.02%$. - In a high-turnover active mutual fund, the TER can add another $0.05%$ to $0.25%$ of annual return drag on top of the stated MER.
2. The Mathematics of Compound Fee Erosion: Why a 2% MER Destroys 40%+ of Your Gains
Let's formalize the exact compound-erosion equations implemented in our Canadian Mutual Fund & ETF Comparator.
Let:
- $C_0$: Initial lump-sum capital invested today (e.g., $50,000)
- $M$: Monthly recurring contribution (e.g., $500 / month, or $A = 12 \times M = $6,000 \text{ / year}$)
- $r_{\text{gross}}$: Expected annual gross market return before fees (e.g., $7.00%$ / year)
- $f_i$: Annual MER of fund $i$ (e.g., $f_A = 2.05%$ for a Series A bank mutual fund vs. $f_{\text{ETF}} = 0.06%$ for a TSX index ETF)
- $T$: Investment horizon in years (e.g., $T = 25\text{ years}$)
Net Annual Compounding Rate ($r_{\text{net}, i}$)
Under the standard CSA projection methodology for comparing funds within the same asset class, the net annual rate of return of fund $i$ is:
$$r_{\text{net}, i} = r_{\text{gross}} - f_i$$
(Actuarial note: In exact continuous/geometric terms, $(1 + r_{\text{net}}) = (1 + r_{\text{gross}})(1 - f_i) = 1 + r_{\text{gross}} - f_i - r_{\text{gross}}f_i$, which makes the fee drag even larger during high-return years).
Terminal Portfolio Value at Horizon $T$ ($FV_i$)
Compounding the initial principal $C_0$ and the annual contributions $A = 12M$ over $T$ years yields:
$$FV(f_i, T) = C_0 (1 + r_{\text{gross}} - f_i)^T + A \cdot \frac{(1 + r_{\text{gross}} - f_i)^T - 1}{r_{\text{gross}} - f_i}$$
Total Compound Opportunity Cost of Fees ($\Omega_i(T)$)
The fatal mistake investors make when glancing at an annual fee statement is summing the annual dollar fees linearly without accounting for lost compound growth: every dollar deducted in fees at Year 3 stops compounding at $7.0%$ per year for the remaining $T - 3$ years.
The true wealth erosion $\Omega_i(T)$ caused by fund $i$'s MER compared to a zero-fee gross market benchmark is:
$$\Omega_i(T) = FV(0, T) - FV(f_i, T)$$
And the Net Wealth Saved by switching from a high-fee Series A bank fund ($f_A$) to a low-cost TSX ETF ($f_{\text{ETF}}$) is:
$$\text{Net Wealth Saved}(A \to \text{ETF}) = FV(f_{\text{ETF}}, T) - FV(f_A, T)$$
Quantitative Proof Across 10, 20, 25, and 30 Years ($C_0 = $50,000$, $M = $500\text{/mo}$, $r_{\text{gross}} = 7.0%$)
Let's compare three standard Canadian vehicles tracking the exact same underlying asset allocation:
- Series A Bank Mutual Fund (Branch): $\text{MER} = 2.05%$ ($r_{\text{net}} = 4.95%$)
- Series F Bank Mutual Fund (Self-Directed / Fee-Based): $\text{MER} = 0.95%$ ($r_{\text{net}} = 6.05%$)
- TSX-Listed Core Index ETF (
XIC.TO/ZCN.TO): $\text{MER} = 0.06%$ ($r_{\text{net}} = 6.94%$)
| Horizon ($T$) | Total Contributed ($C_0 + 12MT$) | Terminal Value Series A ($\text{MER } 2.05%$) | Terminal Value Series F ($\text{MER } 0.95%$) | Terminal Value TSX ETF ($\text{MER } 0.06%$) | Wealth Lost in Series A vs. TSX ETF | Share of Investment Gains Confiscated by Series A |
|---|---|---|---|---|---|---|
| 10 Years | $110,000 | $157,342 | $170,689 | $181,963 | −$24,621 | $33.6%$ of gains |
| 20 Years | $170,000 | $331,024 | $388,016 | $439,912 | −$108,888 | $39.9%$ of gains |
| 25 Years | $200,000 | $455,689 | $556,291 | $651,248 | −$195,559 | $43.0%$ of gains |
| 30 Years | $230,000 | $614,290 | $782,084 | $947,012 | −$332,722 | $46.1%$ of gains |
Look closely at the 25-year row: an investor who starts with $50,000 and contributes $500/month sacrifices $195,559 in net retirement wealth by holding a $2.05%$ Series A mutual fund instead of a $0.06%$ TSX ETF. Over 30 years, the fee drag reaches $332,722—exceeding the investor's entire lifetime cash contributions ($230,000)!
3. Fee Benchmark Across Canada's 7 Major Financial Institutions (Big 6 + Desjardins)
Our Canadian Fund & ETF Comparator indexes real Fundserv codes (RBF454, TDB900, DJT00018, BNS382) alongside live TSX ETF market data (XIC, ZCN, XBB, ZAG, DCU). Here is how the three fund tiers compare across Canada's major institutions:
| Institution | Flagship Series A Mutual Fund (Branch) | Series A MER | Series F / Index Mutual Fund (DIY) | Series F / Ind. MER | Core TSX-Listed ETF Equivalent | TSX ETF MER |
|---|---|---|---|---|---|---|
| RBC | RBC Select Balanced Portfolio (RBF454) |
$1.94%$ | RBC Select Balanced Series F (RBF654) |
$0.92%$ | iShares Core S&P/TSX (XIC.TO — RBC iShares Alliance) |
$0.06%$ |
| TD | TD Comfort Balanced Portfolio (TDB886) |
$1.90%$ | TD Canadian Index Fund — e-Series (TDB900) |
$0.28%$ | iShares Core Canadian Universe Bond (XBB.TO) |
$0.10%$ |
| BMO | BMO SelectTrust Balanced Portfolio (BMO70240) |
$1.98%$ | BMO Balanced Portfolio — Series F (BMO95240) |
$0.88%$ | BMO S&P/TSX Capped Composite (ZCN.TO) |
$0.06%$ |
| Desjardins | Desjardins SociéTerre Balanced (DJT00018) |
$2.02%$ | Desjardins Canadian Equity Series F (DJT03902) |
$0.95%$ | Desjardins Canadian Universe Bond ETF (DCU.TO) |
$0.10%$ |
| Scotiabank | Scotia Partners Balanced Portfolio (BNS382) |
$2.05%$ | Scotia Selected Balanced Series F (BNS582) |
$0.96%$ | Scotia Canadian Equity Index Tracker (SVD) |
$0.10%$ |
| CIBC | CIBC Managed Balanced Solution (CIB512) |
$1.99%$ | CIBC Canadian Index Fund — Series F (CIB500) |
$0.45%$ | CIBC Canadian Equity Index ETF (CCEI.NE) |
$0.05%$ |
| National Bank | Meritage Balanced Portfolio — Series A (NBC7402) |
$2.08%$ | Meritage Balanced Portfolio — Series F (NBC7702) |
$0.98%$ | BMO Aggregate Bond Index ETF (ZAG.TO) |
$0.09%$ |
Why Active Management Rarely Overcomes a 200 bps Fee Hurdle (S&P SPIVA Canada)
Retail bank advisors frequently argue that a $2.00%$ Series A MER is justified because active portfolio managers can outperform the S&P/TSX Composite Index or cushion market downturns. However, the semi-annual S&P Dow Jones Indices SPIVA Canada Scorecard (which corrects for survivorship bias as poorly performing mutual funds are merged or liquidated) consistently proves the opposite:
- Over a 10-year horizon, $88%$ to $94%$ of actively managed Canadian equity, U.S. equity, and global equity mutual funds in Canada underperform their benchmark index net of fees.
- The reason is simple arithmetic: before fees, institutional investors collectively are the market. When one vehicle deducts $2.05%$ every year and an index ETF deducts $0.06%$, the active manager must generate nearly +200 basis points of gross annual alpha year after year just to break even with the passive index ETF.
4. CRM2 vs. Total Cost Reporting (TCR): Why Your Annual Fee Statement Was Only Half the Story
Under Client Relationship Model Phase 2 (CRM2 / MRCC2) rules introduced by the CSA in 2016, Canadian dealers must provide an annual Report on Charges and Other Compensation showing the dollar amount paid to the dealer (such as the $1.00%$ Series A trailing commission).
However, traditional CRM2 statements omitted the investment fund manager's portion of the MER ($0.85%$ to $1.10%$) and the TER. As a result, a Canadian investor holding $250,000 in a Series A mutual fund with a $2.04%$ MER was actually paying $5,100 per year in total fund fees, even though their CRM2 statement only displayed the $2,500 trailing commission paid to the dealer! Under the CSA and CIRO Total Cost Reporting (TCR / RCFT) reforms taking effect across 2026–2027, Canadian financial institutions are finally required to disclose the full dollar amount of all embedded MER and TER charges on client annual statements.
5. How to Transition from High-MER Bank Funds to Low-Cost ETFs Without Triggering Tax
Before selling a high-MER mutual fund, always verify the tax status of the account holding the units:
- Registered Accounts (RRSP, TFSA, FHSA, RRIF, RESP): Selling mutual funds or transferring registered accounts in cash or in kind (via CRA Form T2033 for RRSP/RRIF transfers) to a self-directed brokerage account (such as RBC Direct Investing, TD Direct Investing, BMO InvestorLine, CIBC Investor's Edge, National Bank Direct Brokerage, or Disnat) triggers zero capital gains tax. You can immediately replace a $2.05%$ Series A fund with a $0.06%$ TSX ETF (
XIC.TO,ZCN.TO,XBB.TO) or an all-in-one asset allocation ETF (XBAL.TO,VBAL.TO,XGRO.TO,VGRO.TOat $0.20%–0.24%$ MER) with zero tax friction. - Non-Registered (Taxable) Accounts: Selling an appreciated mutual fund in a non-registered account realizes a taxable capital gain. First check whether your institution permits a tax-neutral Series A $\to$ Series F reclassification within the same mutual fund trust (cutting your MER roughly in half without triggering a taxable disposition), or compute the tax break-even period where the annual $+1.95%$ fee savings outweighs the upfront capital gains tax (typically 2.5 to 4 years when unrealized gains are under $35%$ of market value).
Audit Your Canadian Mutual Funds & ETFs in Seconds
Stop letting a $2%$ embedded fee compound against your retirement. Look up your current bank funds by institution (RBC, TD, BMO, Desjardins, Scotiabank, CIBC, National Bank), Fundserv code, or TSX ticker and calculate your exact 10-, 20-, and 30-year fee savings:
👉 Launch the TrueVerdikt Canadian Fund & ETF Fee Comparator
Want to optimize the registered accounts holding your ETFs as well? Test your tax bracket in our RRSP vs. FHSA & $60k HBP Tax Arbitrage Simulator and build a custom low-MER index portfolio with our Canadian ETF Allocation Generator.
7 Costly Mistakes with RRSP & FHSA in Canada
Check the items that apply to your strategy to calculate your live Tax Erosion Score and unlock the quantitative optimization protocol.
2 / 7 erosion factors selected
Select the potential friction points in your current setup:
Unlock the Full PDF Guide + Your RRSP / FHSA Action Plan
Enter your email to immediately unlock all 7 quantitative remedies, Net Future Return (RNF) formulas, and download the complete guide.
100% Free · Zero spam · Unsubscribe in 1 click.
Custom Portfolio Audit: Canadian Mutual Fund MER Elimination & ETF Transition Blueprint
The institutional audit blueprint to dismantle hidden bank mutual fund fees (RBC, TD, BMO, BNS, CIBC, NBC, Desjardins) and execute a frictionless tax transition to 0.06% - 0.20% TSX index ETFs.
Instant digital delivery • Lifetime access & 2026 updates included • Universal formats
From theory to practice
Understand markets and build an allocation: sector versus index ETFs, rebalancing, currency risk and reading market cycles.
Build an ETF planAuthored & Audited by the TrueVerdikt Quantitative Research Team
Financial engineering, Canadian mortgage actuarial modeling & statistical backtest auditing
Every study published on TrueVerdikt is engineered and verified using deterministic mathematical equations, peer-reviewed academic literature, and primary statutory regulations. No financial institution can alter our algorithms or rankings.
Primary Academic & Regulatory References
- • Bailey, D. H., & López de Prado, M. (2014). The Deflated Sharpe Ratio: Correcting for Selection Bias, Backtest Overfitting, and Non-Normality. The Journal of Portfolio Management, 40(5), 94–107.
- • López de Prado, M. (2018). Advances in Financial Machine Learning (Combinatorial Purged Cross-Validation — CPCV). Wiley.
- • Interest Act of Canada (R.S.C., 1985, c. I-15, s. 6) — Semi-Annual Mortgage Compounding & OSFI Guideline B-20 Residential Underwriting.
- • Canadian Securities Administrators (CSA) — National Instrument 81-101 (Fund Facts, MER/TER) & Canada Revenue Agency (CRA — FHSA, RRSP, HBP).
Keep reading
All articles in this section « Macro & rates » →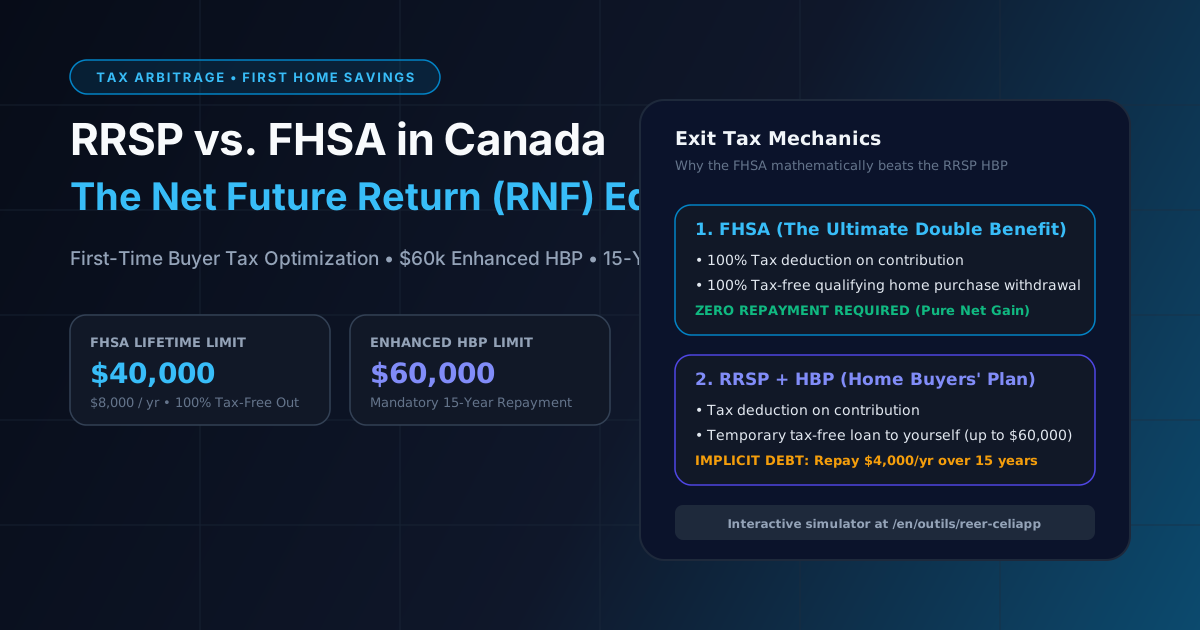
RRSP vs. FHSA in Canada: Mathematical Tax Arbitrage, Marginal Rate Differentials, and the $60,000 Home Buyers' Plan (HBP)
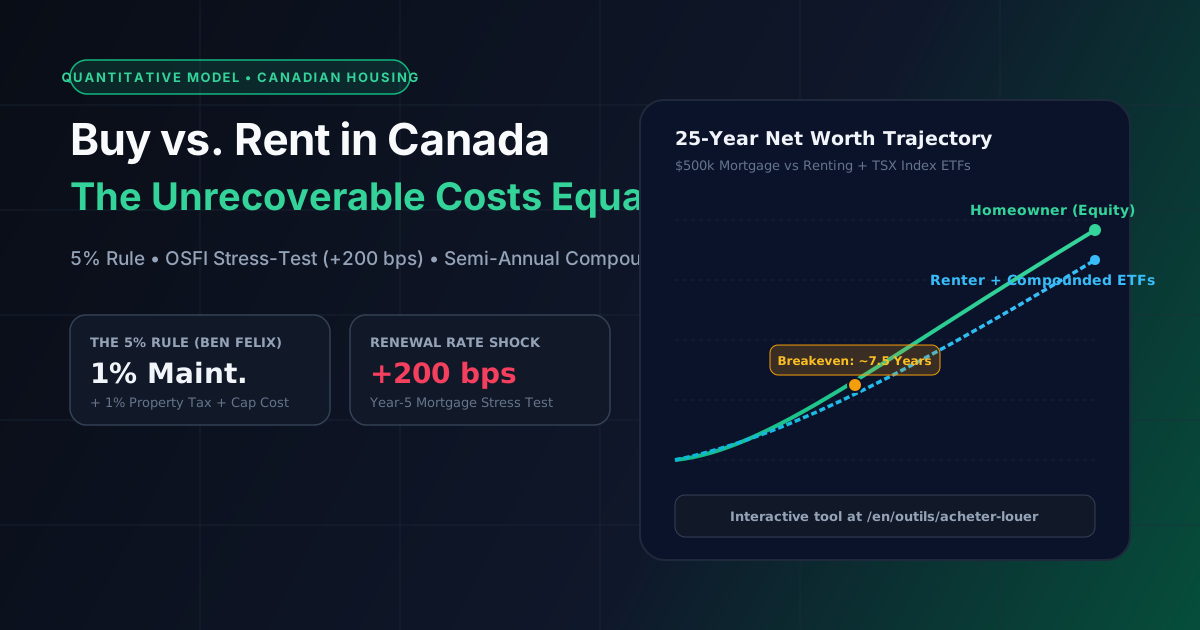
Buy vs. Rent in Canada: The 5% Rule of Unrecoverable Costs, Semi-Annual Compounding, and the +200 bps Renewal Stress Test