NVIDIA Concentration in Canadian ETFs (VFV, XEQT, XUU, ZNQ): HHI, Hidden Correlation, and True Diversification
Quantitative breakdown of NVIDIA (NVDA) and Magnificent 7 weightings inside Canadian-listed ETFs VFV, XEQT, XUU, and ZNQ using HHI, effective holdings, and the Nov 20, 2026 -14% NVDA sell-off.
Last methodological review:
Quantitative Research · Quant Lab
ETF Allocation Planner
Editorial illustration — TrueVerdikt
IN THIS ARTICLE
Key Takeaways (TL;DR)
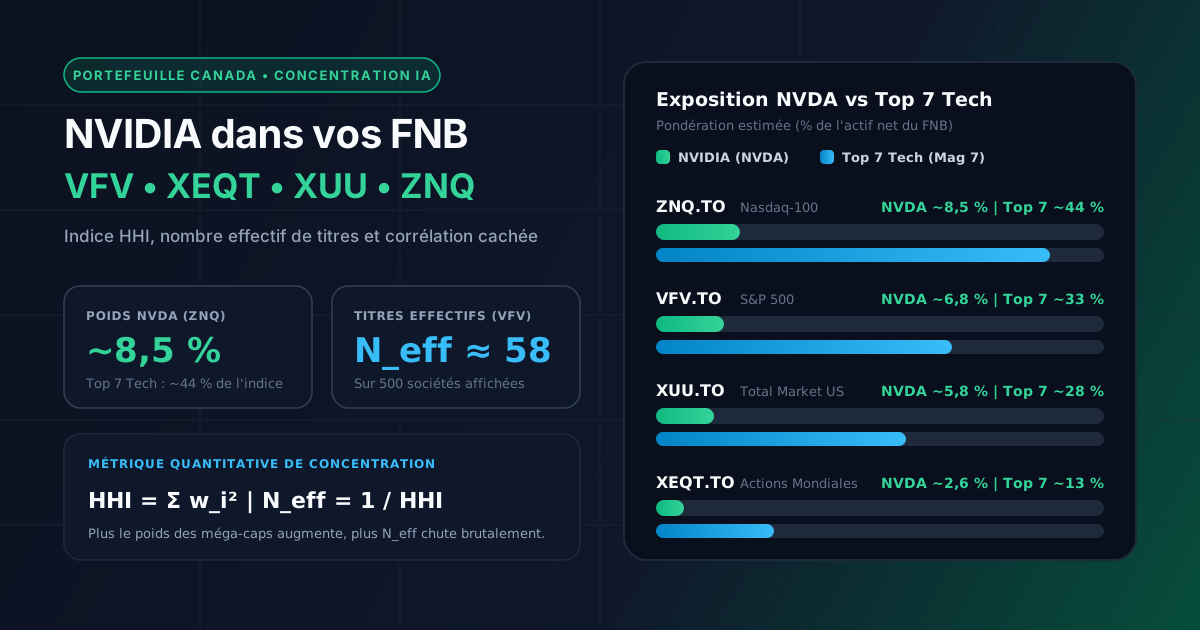
- Holding market-cap-weighted Canadian ETFs such as VFV (500 stocks) or ZNQ (100 stocks) currently yields an effective number of holdings (N_eff) of roughly 58 and 21 respectively.
- NVIDIA alone accounts for approximately 6.8% of VFV, 8.5% of ZNQ, 5.8% of XUU, and 2.6% of XEQT, while the top seven U.S. tech mega-caps represent 13% to 44% of these funds.
- Stacking VFV, XEQT, and ZNQ inside the same TFSA or RRSP creates an illusion of diversification while amplifying hidden correlation to the AI infrastructure CapEx cycle.
- Computing the Herfindahl-Hirschman Index (HHI) provides a rigorous measure of true portfolio concentration before adding any single-stock NVDA position.
The rapid buildout of artificial intelligence computing infrastructure has propelled NVIDIA Corporation (NVDA) to the top of global equity benchmarks, pushing its market capitalization past USD 3 trillion. For Canadian investors allocating capital through Toronto Stock Exchange (TSX)-listed index exchange-traded funds (ETFs)—specifically VFV (Vanguard S&P 500 Index ETF), XEQT (iShares Core Equity ETF Portfolio), XUU (iShares Core S&P U.S. Total Market Index ETF), and ZNQ (BMO NASDAQ 100 Equity Index ETF)—this concentration raises a critical quantitative question: how diversified is a broad index portfolio when a handful of mega-cap technology companies drive most of its total variance?
One of the most common analytical errors among self-directed Canadian investors is conflating the nominal count of securities inside an ETF with the effective number of independent risk drivers. A fund listing 500 or 3,500 constituents on its fact sheet can behave statistically like a concentrated portfolio of a few dozen U.S. growth stocks. This study decomposes the actual look-through weighting of NVIDIA and the top seven U.S. technology mega-caps across Canada's four flagship equity ETFs using the Herfindahl-Hirschman Index (HHI).
To compare management expense ratios (MERs) and fee drag across Canadian funds, explore our Canadian Fund & ETF Comparator or model your target asset mix in the ETF Portfolio Planner.
1. Mechanics of Market-Cap Weighting and Risk Asymmetry
The flagship benchmarks tracked by VFV, XUU, ZNQ, and the U.S. equity sleeve of XEQT rely on float-adjusted market-capitalization weighting. Under this methodology, the portfolio weight of constituent within an index of companies is defined as:
where is the share price of company and is its publicly tradable share count. This design offers a clear structural advantage: it automatically rebalances as prices move without forcing high portfolio turnover, enabling ETFs such as VFV (0.09% MER) and XUU (0.07% MER) to deliver institutional-grade market exposure at minimal cost.
However, market-cap weighting is inherently pro-cyclical, acting as an implicit momentum strategy. As NVIDIA's valuation multiple and market capitalization expand faster than the broader equity universe, its share of every new dollar contributed to VFV or ZNQ rises automatically. Conversely, the smallest 400 companies in the S&P 500 command a shrinking fraction of net assets—meaning a 5% daily move in NVIDIA can exert a larger impact on VFV's return than a simultaneous 10% rally across dozens of industrial or utility constituents.

2. The Herfindahl-Hirschman Index (HHI) and Effective Number of Holdings
To quantify portfolio concentration objectively rather than relying on headline constituent counts, institutional risk managers compute the Herfindahl-Hirschman Index (HHI) across portfolio weights:
In a perfectly equal-weighted portfolio of securities ( for all ), the index reaches its theoretical minimum . At the other extreme, a single-stock portfolio produces .
Taking the reciprocal of the HHI yields the effective number of holdings (), representing the number of equal-weighted positions that would exhibit the exact same concentration profile:
Comparing nominal against exposes the depth of mega-cap concentration. Inside the S&P 500 tracked by VFV, although , the top ten companies now account for more than 35% of index weight. This lifts the index HHI to roughly $0.0172$, compressing the effective number of holdings to:
The compression is even more pronounced inside the Nasdaq-100 (ZNQ). Even with Nasdaq OMX's periodic special-rebalance capping rules, the top seven technology constituents absorb roughly 44% of the fund, pushing down to approximately 21 equivalent stocks.
3. Comparative Matrix: VFV, XEQT, XUU, and ZNQ
The table below summarizes the structural profile, published Canadian MERs, indicative NVIDIA and Top 7 technology weights, and estimated concentration metrics () across all four TSX-listed ETFs. Exact constituent weights fluctuate daily with market prices; the figures reflect the prevailing structure reported in official Vanguard Canada, BlackRock iShares Canada, and BMO Global Asset Management ETF Facts filings.
| TSX ETF Metric | VFV (Vanguard) | XUU (iShares) | ZNQ (BMO) | XEQT (iShares) |
|---|---|---|---|---|
| Underlying Benchmark | S&P 500 | S&P U.S. Total Market | Nasdaq-100 | 100% Global Equity Allocation |
| Nominal Holdings () | ~503 | ~3,500+ | ~101 | ~9,000+ (via 4 underlying ETFs) |
| Management Expense Ratio (MER) | 0.09% | 0.07% | 0.39% | 0.20% |
| Indicative NVIDIA (NVDA) Weight | ~6.8% | ~5.8% | ~8.5% | ~2.6% (via ~45% ITOT sleeve) |
| Indicative Top 7 Tech Weight | ~33% | ~28% | ~44% | ~13% |
| Estimated HHI | ~0.0172 | ~0.0128 | ~0.0475 | ~0.0048 |
| Effective Holdings () | ~58 | ~78 | ~21 | ~208 |
| U.S. Geographic Exposure | 100% | 100% | 100% | ~45% (Canada ~25%, EAFE ~25%, EM ~5%) |
Three quantitative insights stand out from this comparison:
- XUU modestly dilutes mega-cap concentration compared to VFV by incorporating U.S. mid- and small-cap equities (roughly 15% to 18% of total weight), lifting from ~58 to ~78 while charging a slightly lower MER (0.07% vs. 0.09%). Still, the Top 7 tech bloc accounts for roughly 28% of the fund.
- XEQT acts as a structural concentration buffer: by capping U.S. exposure near 45% (through its underlying ITOT holding) alongside ~25% Canadian equities (XIC, tilted toward financials and energy) and ~30% international developed and emerging markets (XEF and XEC), NVIDIA's look-through weight drops to ~2.6% and rises above 200.
- ZNQ combines sector concentration with a higher fee: its 0.39% MER is more than four times VFV's fee for an equity basket heavily concentrated in U.S. growth and semiconductor/cloud mega-caps.
4. Hidden Correlation and the "ETF Stacking" Illusion
A frequent portfolio construction pitfall among Canadian retail investors is stacking multiple popular ETFs inside a TFSA, RRSP, or FHSA under the assumption that holding more tickers equates to broader diversification. Consider a widely observed allocation: 40% XEQT + 30% VFV + 20% ZNQ + 10% direct NVDA shares.
Computing the true look-through weight of NVIDIA across this combined portfolio reveals the hidden concentration:
Applying the same look-through decomposition to the Top 7 technology bloc (including the direct NVDA position) shows that roughly 33.9% of the investor's total equity capital rests on just seven U.S. companies tied to a single macroeconomic theme: hyperscaler capital expenditures (CapEx) on AI compute infrastructure by Microsoft, Alphabet, Amazon, and Meta.
This overlap is compounded by conditional tail correlation. During calm market regimes, daily return correlations between semiconductor designers and consumer software platforms appear moderate. During a repricing of AI CapEx growth or a sharp spike in U.S. real interest rates, however, the covariance matrix tightens sharply toward 1. Because NVIDIA's annualized realized volatility (historically 45% to 55%) is roughly three times that of the broad S&P 500 (~15% to 17%), its Marginal Contribution to Risk far exceeds its nominal portfolio weight.
Portfolio variance, , becomes dominated by the off-diagonal covariance terms among U.S. technology leaders. Adding ZNQ on top of VFV does not diversify risk; it mathematically increases portfolio beta to the U.S. technology growth factor.
November 20, 2026 Update: Real-World Governance Shock Stress Test
The trading week ending November 20, 2026 delivered a live empirical stress test of single-stock concentration. On November 20, 2026, Reuters reported that the U.S. Securities and Exchange Commission (SEC) had opened an accounting probe into NVIDIA—a development that must be framed with strict regulatory discipline, as an SEC inquiry or investigation does not constitute proof of wrongdoing or an enforcement finding.
Even so, global equity markets immediately priced in a governance uncertainty premium: NVDA fell roughly 13% to 14% on the week, helping drag the Nasdaq Composite down approximately 5% year-to-date (YTD). Using pre-shock index weights, the first-order arithmetic impact of a single-stock drawdown across Canadian ETFs is immediate:
For VFV () and XUU (), the direct mechanical drag reaches and respectively, before accounting for secondary spillover into semiconductor suppliers and cloud hyperscalers. In the "stacked" Canadian portfolio analyzed above (), NVIDIA's weekly drop alone shaved off total portfolio value in five sessions—underscoring why HHI concentration risk materializes abruptly during idiosyncratic shocks.
5. Structural Portfolio Audit Considerations for Canadian Investors
From a quantitative risk-management perspective, three checks help keep index portfolios aligned with their intended risk budget:
- Perform a look-through audit before adding single stocks: Before buying NVDA directly or adding a thematic AI ETF, calculate the exact dollar exposure already embedded in core index holdings. The ETF Portfolio Planner helps map regional and asset-class weights across combined accounts.
- Evaluate fee-to-overlap efficiency: Paying a 0.39% MER on ZNQ when 85% to 90% of its market-cap weight already sits inside VFV (0.09%) or XUU (0.07%) introduces avoidable fee drag. You can model long-term MER compounding in the Canadian Fund & ETF Comparator.
- Account for unhedged CAD/USD currency exposure: VFV, XUU, and ZNQ are unhedged in Canadian dollars. A strengthening Canadian dollar reduces CAD-denominated returns even if NVIDIA rises in USD, though unhedged USD exposure has historically cushioned Canadian equity portfolios during global risk-off drawdowns when the U.S. dollar rallies.
Record concentration around NVIDIA and U.S. mega-cap technology does not invalidate low-cost index investing, but it requires replacing headline intuition ("I own 500 stocks") with quantitative diagnostics (, HHI, and look-through weight).

Primary Sources and Regulatory Filings
- Vanguard Investments Canada Inc. — Vanguard S&P 500 Index ETF (VFV) — ETF Facts & Fund Profile, Toronto Stock Exchange (TSX) / SEDAR+.
- BlackRock Asset Management Canada Limited — iShares Core Equity ETF Portfolio (XEQT) & iShares Core S&P U.S. Total Market Index ETF (XUU) — ETF Facts & MRFP, SEDAR+.
- BMO Global Asset Management — BMO NASDAQ 100 Equity Index ETF (ZNQ) — Prospectus & ETF Facts, Toronto Stock Exchange (TSX).
- U.S. Securities and Exchange Commission (SEC) — EDGAR & Reuters (November 20, 2026) — NVIDIA Corporation Form 10-K Annual Report, S&P Dow Jones Indices U.S. Indices Methodology, and Reuters reporting on the SEC accounting inquiry and Nasdaq weekly sell-off.
Analytical Disclaimer: This article is published strictly for educational and quantitative informational purposes. It does not constitute personalized financial advice or a recommendation to buy or sell any specific security or ETF. Index weights and expense ratios fluctuate over time.
ETF Allocation Planner
Project deterministic ETF contribution ranges and structure asset classes across tax wrappers.
Open ETF PlannerIndependent financial engineer based in Quebec, Canada, Alain Legrand builds and audits TrueVerdikt's deterministic models: Series A/F mutual fund vs. TSX ETF fee comparisons, RRSP/FHSA tax arbitrage, Canadian mortgage actuarial schedules, and statistical overfitting detection (Deflated Sharpe Ratio & CPCV).
Primary Regulatory & Academic Sources
- OSFI — Guideline B-20 (Residential Mortgage Underwriting) — Residential mortgage underwriting practices, procedures, and minimum qualifying rate stress-test.
- CRA — FHSA, RRSP & Home Buyers' Plan — Official contribution limits ($8,000/yr, $40,000 lifetime FHSA cap), tax deductions, and HBP repayment rules.
- CIFSC — Canadian Investment Funds Standards Committee — Standardized classification of Canadian mutual funds and ETFs used across our MER fee comparator.
- Bailey & López de Prado (2014) — The Deflated Sharpe Ratio — Correcting for Selection Bias, Backtest Overfitting, and Non-Normality. The Journal of Portfolio Management, 40(5), 94–107 (SSRN).
Keep reading
All articles in this section « Macro & rates » →
Circular AI Financing, CUDA vs. TPU/Trainium, and Risk Parity: Auditing Global Portfolio Exposure

Buying NVIDIA (NVDA) & Anthropic (ANT) in USD from Canada: FX Fees, Norbert's Gambit, CDRs, and RRSP/TFSA Tax Rules
