Anthropic's Record $81B IPO (ANT) & the Global AI Sell-Off: Valuation, Data-Center CapEx, and Rebalancing Discipline
Global analysis of Anthropic's record $81B IPO (priced at $83, +17% to $97.17, then -9% to -11% on Day 2) amid Nasdaq -5% YTD and Asia's worst week since 2020: historical mega-IPO benchmark, KaTeX CapEx/valuation math, and global rebalancing.
Last methodological review:

Quantitative Research · Quant Lab
ETF Allocation Planner
Photo: Frank Schulenburg — Wikimedia Commons (CC BY-SA 4.0)
IN THIS ARTICLE
Key Takeaways (TL;DR)
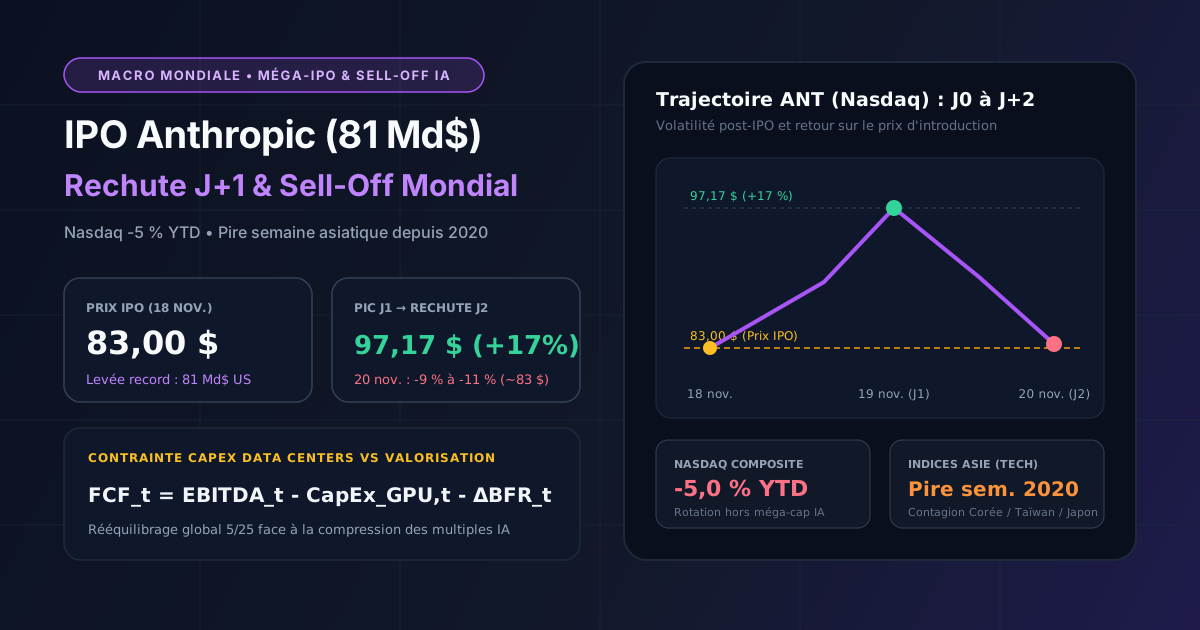
- Anthropic's record USD 81B IPO (Nasdaq: ANT, priced at USD 83 on Nov 18, 2026) surged +17% to USD 97.17 on debut day before tumbling 9% to 11% back toward ~USD 83 on Nov 20.
- The Day-2 reversal unfolded alongside a global AI equity sell-off that pushed the Nasdaq Composite to -5% YTD and handed Asian stock markets their worst weekly loss since 2020.
- Unlike asset-light software IPOs, frontier LLM laboratories face massive recurring data-center CapEx that compresses Free Cash Flow (FCF) multiples whenever discount rates rise.
- For global investors across the US, Europe, Asia, and Canada, systematic threshold rebalancing (5/25 rule) consistently outperforms chasing post-IPO euphoria.
Within forty-eight hours, global equity markets experienced the sharpest stress test of the artificial intelligence investment cycle to date. On November 18, 2026, Anthropic PBC priced one of the largest Initial Public Offerings in financial history at USD 83.00 per share, raising a record USD 81 billion. When trading commenced on the Nasdaq under ticker ANT on November 19, shares jumped +17% to USD 97.17, driven by intense institutional and retail demand for pure-play frontier AI exposure.
By November 20, 2026, however, euphoria reversed abruptly: ANT dropped -9% to -11%, surrendering nearly its entire Day-1 pop to trade back near ~USD 83. As reported by Reuters, the BBC, and The Guardian, the reversal was no isolated stock-specific hiccup—it collided with a global AI equity sell-off that left the Nasdaq Composite down roughly 5% year-to-date (YTD) and inflicted on Asian equity markets their worst week since 2020, led by steep declines across Korean, Taiwanese, and Japanese semiconductor suppliers.
Why did a record USD 81 billion listing fail to ignite a sustained risk-on rally? This study benchmarks ANT against landmark mega-tech IPOs of the past fifteen years, derives the mathematical tension between enterprise valuation and data-center CapEx, and outlines a disciplined global rebalancing framework for volatile regimes.
To stress-test your long-term savings trajectory and establish objective drift bands across regions, use our Investment Plan Simulator and Portfolio Rebalancing Tool.
1. Benchmarking Anthropic (ANT) Against Historical Mega-Tech IPOs
Financial history demonstrates that record-breaking IPOs frequently arrive near peak sectoral enthusiasm or liquidity inflection points. When a single offering absorbs tens of billions of dollars in fresh equity capital, long-only institutional managers must often liquidate existing technology positions (NVIDIA, cloud hyperscalers, Asian foundries) to fund their allocations—creating a measurable crowding-out effect across global tech indices.
The matrix below benchmarks Anthropic's November 2026 debut against four landmark mega-tech listings:
| Issuer (Ticker) | Year / Exchange | Offering / Implied Valuation | Day-1 Pop | Post-IPO Trajectory | Launch CapEx Intensity |
|---|---|---|---|---|---|
Anthropic (ANT) |
Nov 2026 (Nasdaq) | USD 81B (priced @ $83) | +17% ($97.17 high) | -9% to -11% on Day 2 (~$83) | Extreme (data centers / compute) |
Alibaba (BABA) |
Sept 2014 (NYSE) | +38% | Multi-month base, then >2× over 3 yrs | Low-to-moderate (marketplace) | |
Meta / Facebook (META) |
May 2012 (Nasdaq) | +0.6% | -50% drawdown in 4 months before recovery | Moderate (web servers) | |
Rivian (RIVN) |
Nov 2021 (Nasdaq) | +29% | Peaked at $179, then > -85% drawdown | Very high (EV manufacturing) | |
Arm Holdings (ARM) |
Sept 2023 (Nasdaq) | +25% | Initial pullback, followed by strong rally | Very low (IP licensing) |
The structural divide is unmistakable: asset-light listings (IP licensing or digital marketplaces such as Arm or early Alibaba) convert revenue expansion rapidly into Free Cash Flow. By contrast, extreme-CapEx business models—whether electric-vehicle factories or gigawatt-scale AI compute clusters—face unforgiving multiple compression whenever financing costs remain elevated or enterprise return on investment is questioned.

2. Valuation Math vs. the Data-Center CapEx Wall
The -9% to -11% pullback in ANT on November 20, alongside Asia's worst trading week since 2020, reflects a global repricing of Return on Invested Capital (ROIC) across the AI stack. Institutional valuation models anchor an issuer's enterprise value multiple to sustainable Free Cash Flow ():
Under a steady-state Gordon growth approximation with weighted average cost of capital , perpetual growth rate (), effective tax rate , depreciation shield , and compute capital intensity , the theoretical enterprise-value-to-revenue multiple satisfies:
This equation exposes the core financial tension driving November 2026's global AI sell-off:
- Because frontier GPU and ASIC accelerators face rapid 3- to 4-year economic obsolescence cycles, compute capital intensity remains structurally elevated (frequently 25% to 40%+ of gross revenue).
- Consequently, even a modest +100 bps rise in the required discount rate (driven by governance headlines or macro uncertainty) or a slight downward revision to terminal growth compresses the justifiable multiple by 20% to 35% instantaneously.
That exact mathematical elasticity links ANT's Day-2 slide in New York, the Nasdaq's drop to -5% YTD, and the synchronized sell-off across South Korean, Taiwanese, and Japanese hardware exporters.
3. Global Contagion: Why Asia Recorded Its Worst Week Since 2020
For international investors spanning North America, Europe, and Asia-Pacific, the events of November 18–20 highlight the global vertical integration of the AI factor:
- United States (Nasdaq -5% YTD): Epicenter of frontier LLM valuations, cloud hyperscalers, and GPU design.
- Asia (Taiwan, South Korea, Japan): Physical manufacturing backbone (leading-edge foundries, HBM memory, packaging substrates, and testing equipment). When equity markets simultaneously question post-IPO AI monetization (
ANT) and governance at the dominant GPU architect (NVDA), Asian semiconductor benchmarks act as a high-beta amplifier of U.S. CapEx sentiment. - Europe and Canada: Lower direct AI weight inside domestic benchmarks (outside niche champions such as ASML in the Netherlands or Canadian software leaders), yet substantial indirect exposure through global market-cap ETFs (MSCI World / S&P 500) held in retirement and pension portfolios.
Beyond equity indices, the global sell-off also transmitted through foreign-exchange and sovereign-yield channels. Historically, sharp technology drawdowns in New York trigger short-term U.S. dollar strength against export-oriented Asian currencies (the South Korean won and New Taiwan dollar) as well as commodity-linked currencies such as the Canadian dollar. For unhedged international investors in London, Frankfurt, Tokyo, or Toronto, currency appreciation in the U.S. dollar partially buffers local-currency equity losses—whereas currency-hedged ETF holders absorb the full USD drawdown without that shock absorber.
Another frequently overlooked mechanism in record-sized IPOs is the post-listing lock-up supply calendar. Standard U.S. underwriting agreements restrict insiders, venture-capital syndicates, and early employees from selling shares for 180 calendar days (extending into May 2027 for ANT). Institutional desks routinely discount valuations ahead of lock-up expirations, especially when a stock trades near or below its initial offering price of USD 83.00. Empirical IPO research compiled by Professor Jay Ritter at the University of Florida demonstrates that mega-cap offerings priced at elevated sales multiples frequently experience prolonged consolidation phases during their first six to twelve months on public markets while earnings catch up with initial headline valuations.
4. Systematic Global Rebalancing Discipline in Volatile Regimes
When a flagship IPO swings +17% on Day 1 and -9% to -11% on Day 2, the primary destroyer of individual investor wealth is rarely market volatility itself—it is the behavior gap caused by buying at USD 97.17 during peak enthusiasm and selling during panics.
Institutional portfolio management replaces emotional timing with threshold-based rebalancing (the 5/25 rule). Given a target asset-class weight (e.g., U.S. equities, International Developed/Asia, Fixed Income), rebalancing is triggered strictly when drift breaches:
This mechanical rule enforces two contrarian disciplines automatically:
- Trimming overheated sleeves when AI/tech allocations breach upper corridors, without requiring investors to predict exact market tops.
- Rotating systematically into oversold regions (such as discounted Asian or European equity sleeves following a capitulation week) while preserving the portfolio's original risk budget.
You can calibrate custom regional corridors in our Portfolio Rebalancing Tool and simulate disciplined periodic contributions (Dollar-Cost Averaging) inside the Investment Plan Simulator.

Primary Sources and International References
- Reuters (November 18–20, 2026) — Reporting on Anthropic's record USD 81 billion Nasdaq IPO (
ANT), its Day-2 pullback of 9%–11%, and Asian equities' worst weekly decline since 2020. - U.S. Securities and Exchange Commission (SEC) & Nasdaq — Anthropic PBC Form S-1 Registration Statement and official listing data (USD 83.00 pricing, USD 97.17 Day-1 peak).
- The Guardian & BBC News (November 2026) — Global macroeconomic coverage of the AI equity sell-off and investor scrutiny over data-center capital expenditure.
- Ritter, J. R. (University of Florida) — Initial Public Offerings: Updated Statistics (long-term empirical research on average 12- to 36-month post-IPO relative performance across large-cap offerings).
Analytical Disclaimer: This macroeconomic and quantitative analysis is published strictly for informational and educational purposes. It does not constitute personalized financial advice or a recommendation to buy or sell shares of Anthropic (ANT) or any other security.
ETF Allocation Planner
Project deterministic ETF contribution ranges and structure asset classes across tax wrappers.
Open ETF PlannerIndependent financial engineer based in Quebec, Canada, Alain Legrand builds and audits TrueVerdikt's deterministic models: Series A/F mutual fund vs. TSX ETF fee comparisons, RRSP/FHSA tax arbitrage, Canadian mortgage actuarial schedules, and statistical overfitting detection (Deflated Sharpe Ratio & CPCV).
Primary Regulatory & Academic Sources
- OSFI — Guideline B-20 (Residential Mortgage Underwriting) — Residential mortgage underwriting practices, procedures, and minimum qualifying rate stress-test.
- CRA — FHSA, RRSP & Home Buyers' Plan — Official contribution limits ($8,000/yr, $40,000 lifetime FHSA cap), tax deductions, and HBP repayment rules.
- CIFSC — Canadian Investment Funds Standards Committee — Standardized classification of Canadian mutual funds and ETFs used across our MER fee comparator.
- Bailey & López de Prado (2014) — The Deflated Sharpe Ratio — Correcting for Selection Bias, Backtest Overfitting, and Non-Normality. The Journal of Portfolio Management, 40(5), 94–107 (SSRN).
Keep reading
All articles in this section « Macro & rates » →
Circular AI Financing, CUDA vs. TPU/Trainium, and Risk Parity: Auditing Global Portfolio Exposure

Buying NVIDIA (NVDA) & Anthropic (ANT) in USD from Canada: FX Fees, Norbert's Gambit, CDRs, and RRSP/TFSA Tax Rules